Data processing has become a vital component for the success of businesses in the modern world. While batch processing used to be the primary method for data processing, data streaming has emerged as a promising alternative for real-time data processing. In this article, we will delve into the Confluent Platform, one of the leading data streaming platforms in the market, and explore its features and benefits.

Stream processing
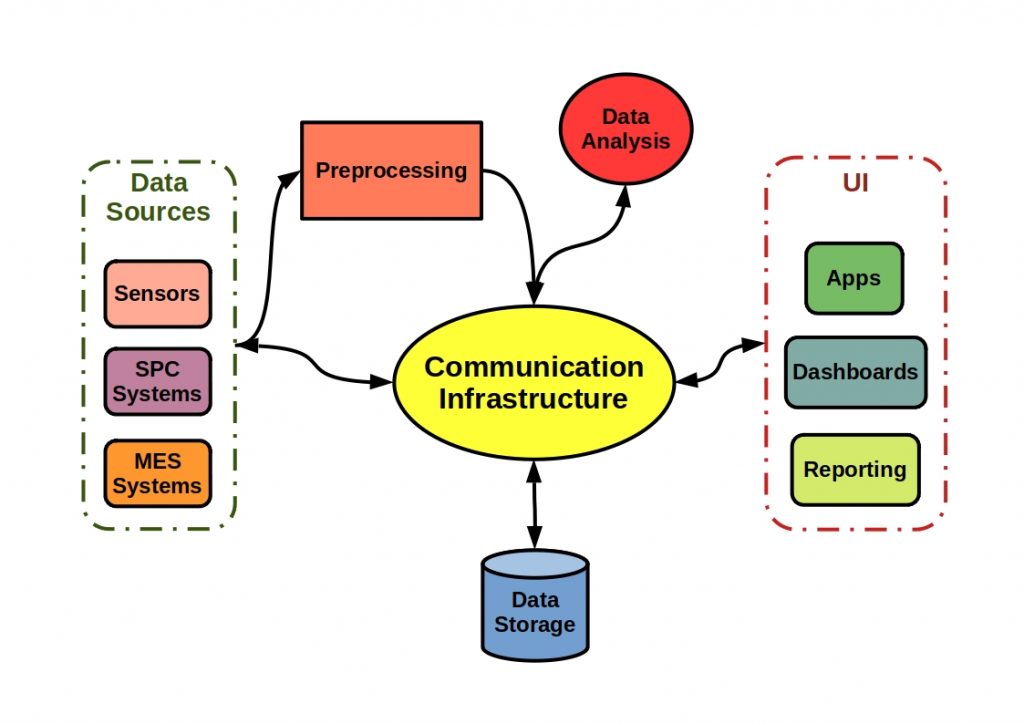
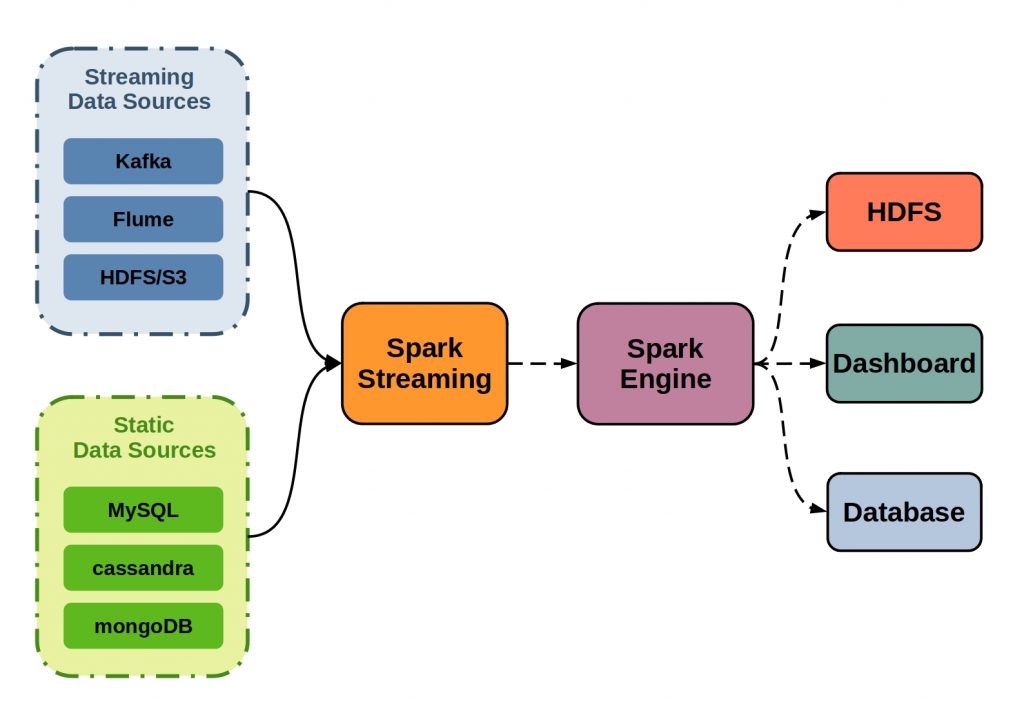
Stream processing, also known as data streaming, refers to a software paradigm where continuous data streams are captured, processed, and managed in real-time. Unlike traditional data processing, which relied on batch processing, real-time data processing enables businesses to gain insights into their data as events occur, rather than after the fact. This is particularly essential in today’s dynamic business environment, where data is rarely static.
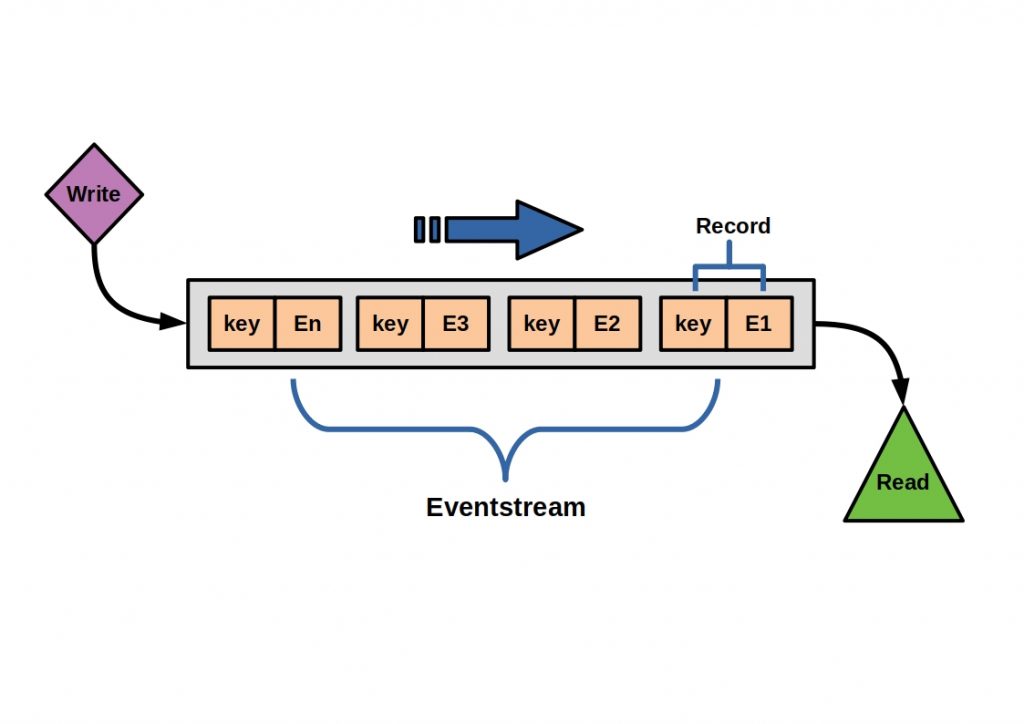


Apache Kafka
The Confluent Platform is a comprehensive event streaming platform that builds on top of Apache Kafka, a message broker that allows data to be stored in topics as logs, enabling any number of clients to subscribe and rewrite the data. Microservices can access the data streams from multiple topics with ease, and data structure remains consistent, regardless of programming languages and technology used. Confluent Platform provides additional features such as the Schema Registry, Kafka Connect, and Control Center.
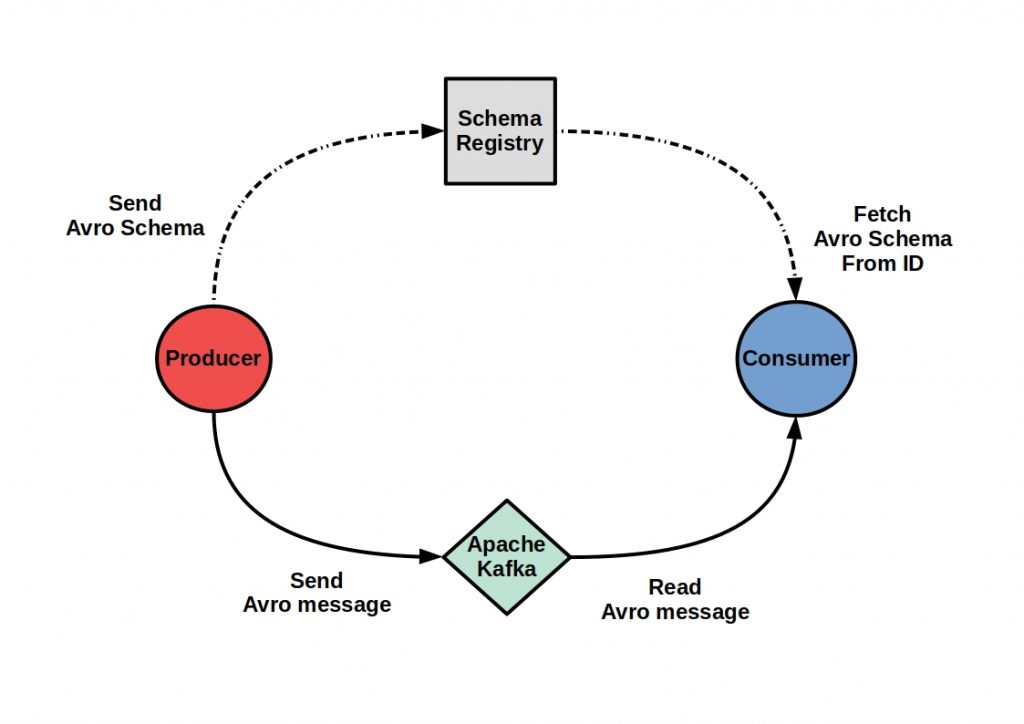
Schema Registry
The Schema Registry allows for the management of schema versions for data stored in Kafka, ensuring that data is properly structured and can be easily consumed by different systems. Kafka Connect simplifies the integration of Kafka with other systems, while Control Center provides a graphical user interface for monitoring and managing Kafka clusters.


Confluent tools and services
Confluent offers additional tools and services such as Confluent Cloud, a fully-managed cloud service for event streaming, and Confluent Hub, a centralized marketplace for Kafka connectors and other Kafka-related extensions. With the Confluent Platform, businesses can leverage the power of real-time data processing to gain a competitive edge in today’s market.
ksqlDB
One of the key components of the Confluent Platform is ksqlDB, an event streaming database that allows for easy transformation of data within Kafka’s data pipelines. With ksqlDB, microservices can enrich and transform data in real-time, enabling anomaly detection, real-time monitoring, and real-time data format conversion. This is made possible by window-based query processing, which allows continuous stream queries based on window-based aggregation of events. Windows are polling intervals that are continuously executed over the data streams. Several window types are available, such as Tumbling, Bouncing, and Session, and they differ in their composition to each other. In addition to continuous queries through window-based aggregation of events, ksqlDB offers many other features that are helpful in dealing with streams.
For example, the last value of a column can be tracked when aggregating events from a stream into a table. Multiple streams can be merged by real-time joins or transformed in real-time. The database is distributed, fault-tolerant, and scalable, and Kafka Connect connectors can be executed and controlled directly.
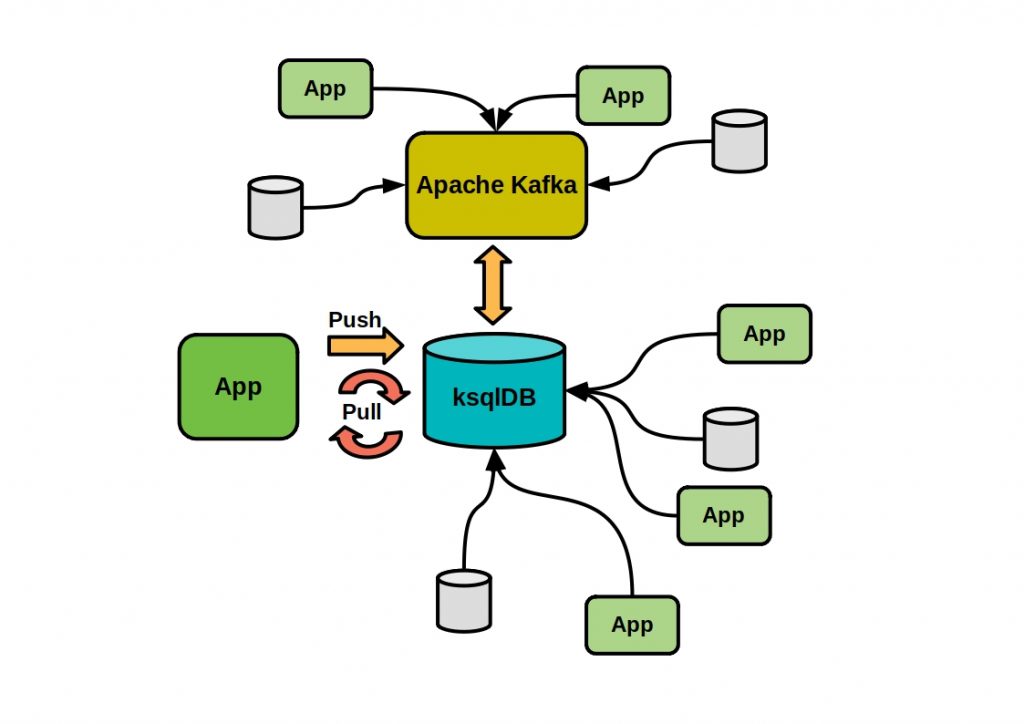


Confluent’s event streaming database ksqlDB offers an excellent solution for real-time data stream processing with Kafka. Kafka is an ideal solution as a central element in a microservice-based software architecture. Microservices can run as separate processes and consume in parallel from the message broker, and ksqlDB ensures real-time stream processing within the services.
Conclusion
In conclusion, real-time data streaming and processing is the future of data processing, with businesses increasingly relying on this technology to gain insights from their data as events occur. Data streaming complements batch processing instead of completely replacing it. Batch processing is still used for tasks where real-time processing is not required, such as generating reports or conducting periodic data analysis. On the other hand, data streaming is used for tasks that require real-time processing, such as monitoring IoT devices or processing financial transactions in real-time. The two approaches complement each other and can be combined depending on the use case to achieve the best results. While the Confluent Platform offers a robust set of tools and services for real-time data processing, it is important to note that there are several alternatives available in the market. As technology continues to evolve, it is difficult to predict which platform or solution will emerge as the dominant player in the field. However, it is clear that real-time data processing and streaming will continue to play a crucial role in helping businesses stay competitive in today’s market.
