Matplotlib vs Seaborn – Matplotlib is often the first choice when it comes to creating mathematical plots with Python. But is it always the best choice? With Seaborn there is a potent competitor.
Matplotlib was developed by John D. Hunter back in 2003 and has become indispensable. Due to the increasing importance of the Python programming language in almost all scientific areas, the importance of fully compatible visualization methods is also growing.
Due to its open source concept, Matplotlib can be used absolutely free of charge and is a basic component of many popular Python distribution platforms, such as Anaconda.
The library offers a MATLAB-like interface and can be used in combination with NumPy, Pandas and Scipy, just like MATLAB.
SciPy is a collection of mathematical algorithms and convenience functions and is mainly used by scientists, analysts and engineers for scientific computing, visualization and related activities.
NumPy allows easy handling of vectors, matrices, or large multidimensional arrays in general.
NumPy’s operators and functions are optimized for multidimensional array operations and evaluate particularly efficiently.
Pandas is also an open source Python library that can be used to perform data analysis and manipulation efficiently. Its strength lies in the processing and evaluation of tabular data and time series.
These components, which are absolutely compatible with each other, offer in their entirety an absolutely free, but fully comprehensive alternative to the commercial analysis software MATLAB.
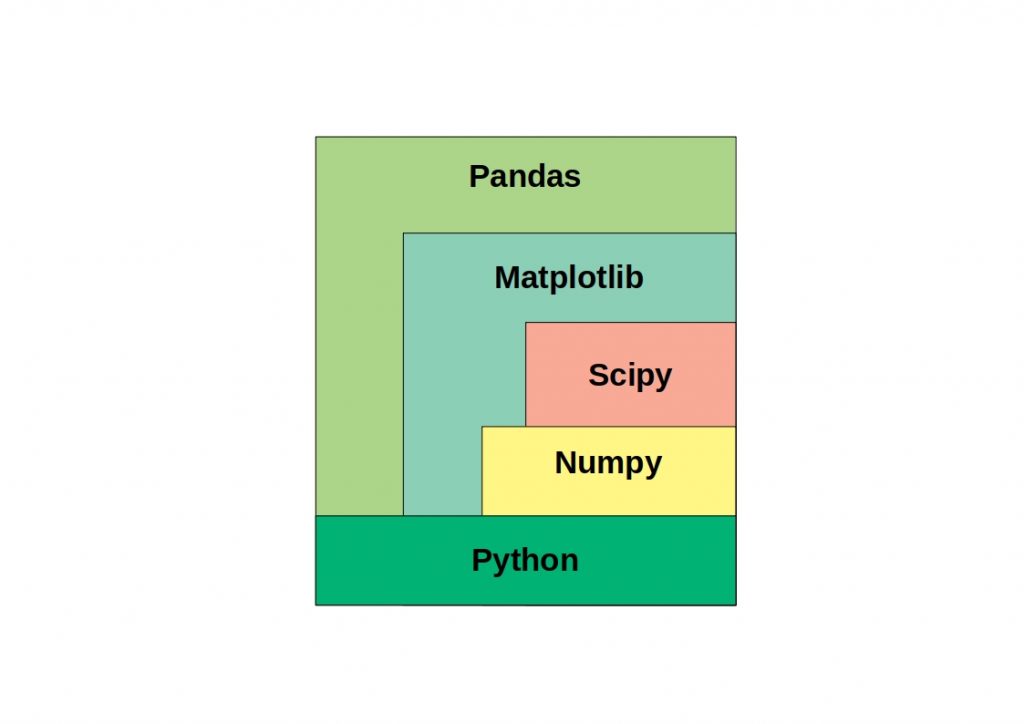


Table of Contents
Python Matplotlib – What are the features?
The library offers a wide range of visualization functions. Some of them are listed in the figure below.
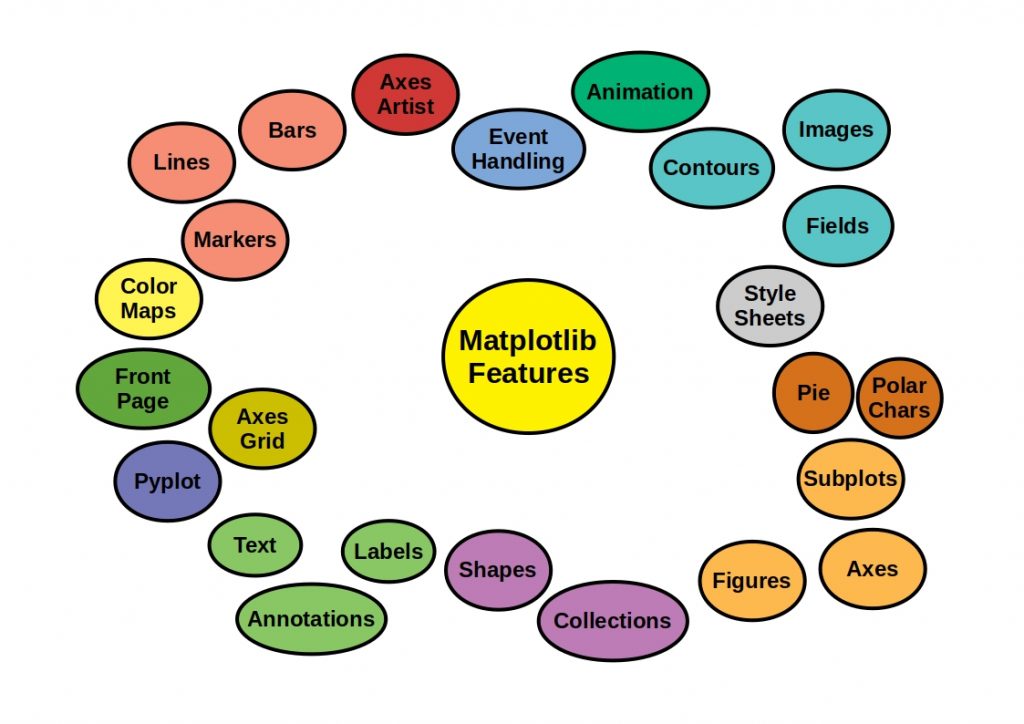


Matplotlib is designed to effectively visualize the results of mathematical calculations. Visualization is an efficient and important data analysis tool.
The library is able to generate all the usual diagrams and figures by default. It is even possible to create animations that can be used to better understand the flow of certain algorithms.
Event Handling
Matplotlib offers an important feature with event handling. Behind the name is a UI-neutral event model. This allows the library to connect to events without knowing which UI Matplotlib will eventually plug into.
This allows me to develop a very flexible and portable code.
However, the events can then be used to transfer things like the data coordinate.
PyLab vs Pyplot
PyLab is a collection of functions that is installed together with Matplotlib and make the library work like MATLAB.
The module brings a set of NumPy functions and classes into the namespace. This makes them accessible without having to import them.
However, this often led to conflicts between individual Matplotlib functions.
For this reason, the use of PyLab is now no longer recommended.
Pyplot is a module in Matplotlib and provides the state-machine interface to the underlying plotting library.
The conflicts are prevented because an import is done with Pyplot and a separate NumPy import.
Python Matplotlib – Third party packages
If the standard library features are not enough, you can extend Matplotlib with additional external packages. In the following figure some of the possible extensions are listed and grouped by application.
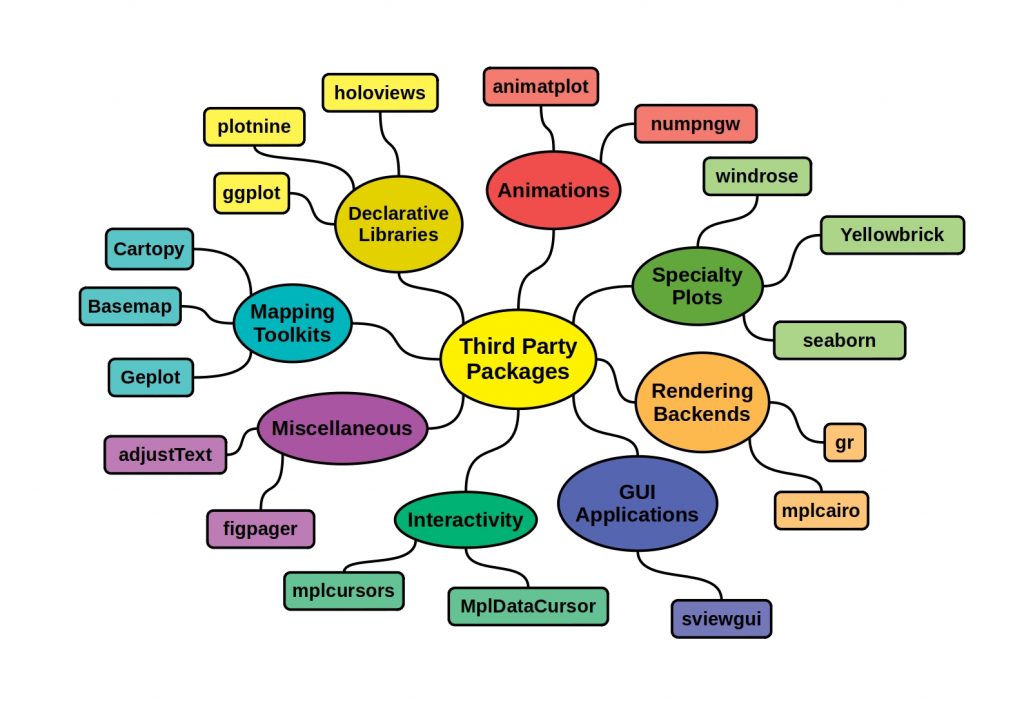


These external packages must be installed individually and extend the functionality of the plotting library, or build on existing features.
They sometimes offer more complex graphics or higher performance data analysis methods. Most of these packages are open source and are constantly updated by very active communities.
Matplotlib also has weaknesses
Matplotlib is not perfect despite the wide feature set. For example, only poor default options for the size and colors of plots are offered. Matplotlib is often considered to be a low-level technology compared to today’s requirements. Thus, very specialized code is needed to generate appealing plots.
What is Seaborn?
Seaborn is a Python visualization library, but based on Matplotlib. This library provides a high-level interface for visualization of statistical data and not only has its own graphics library, but internally uses Matplotlib’s functionalities and data structures.
It thus offers a variety of additional features besides the śtandard Matplotlib functions.
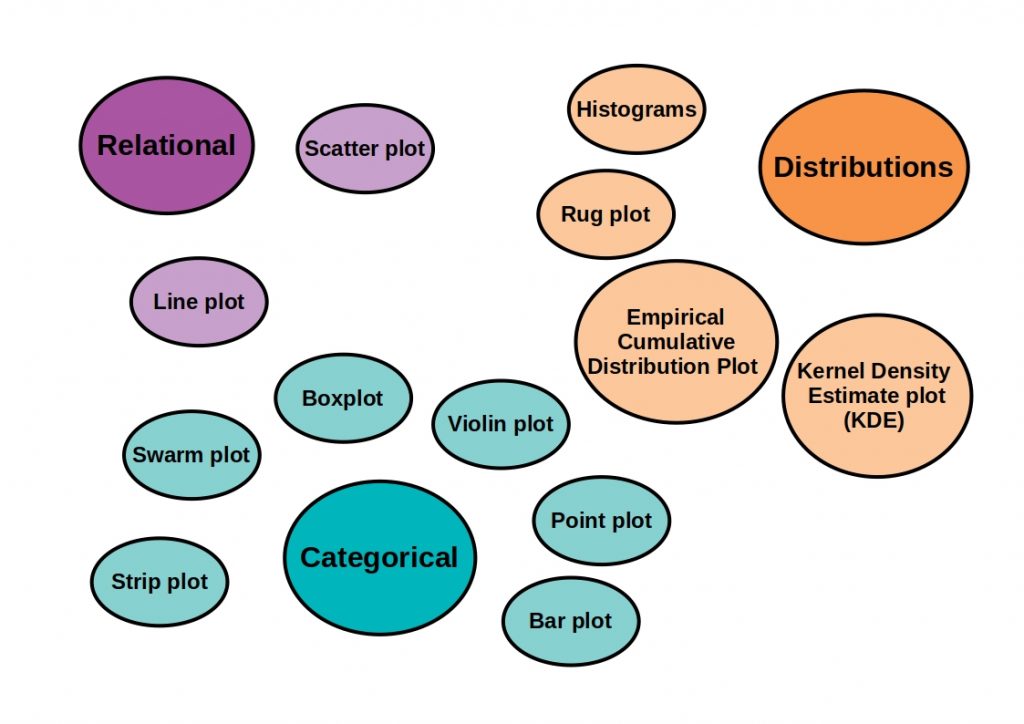


Among other things, Seaborn provides built-in themes for designing matplotlib graphs and a dataset-oriented API for determining the relationship between variables. It can visualize both univariate and bivariate data and plot statistical time series. Estimation and plotting of linear regression models run automatically and Seaborn, unlike Matplotlib, offers optimization when processing NumPy and Pandas data structures.
So what should you choose?
Especially when it comes to deep statistics, Seaborn clearly has the edge. Matplotlib, however, is often the leaner solution due to its simplicity. So both have their strengths and weaknesses. Which tool you ultimately choose depends on the situation. You can’t do much wrong. With one solution, however, you have more contextual options. But now that you know the differences between the two, this decision will be easier for you.
Leave a Reply