EXPERT KNOWLEDGE AT A GLANCE

Category: Uncategorized (Page 1 of 3)

Real-time Streamig with Confluent Platform: The Future of Data Processing

Data processing has become a vital component for the success of businesses in the modern world. While batch processing used to be the primary method for data processing, data streaming has emerged as a promising alternative for real-time data processing. In this article, we will delve into the Confluent Platform, one of the leading data streaming platforms in the market, and explore its features and benefits.

1

Stream processing

Stream processing, also known as data streaming, refers to a software paradigm where continuous data streams are captured, processed, and managed in real-time. Unlike traditional data processing, which relied on batch processing, real-time data processing enables businesses to gain insights into their data as events occur, rather than after the fact. This is particularly essential in today’s dynamic business environment, where data is rarely static.
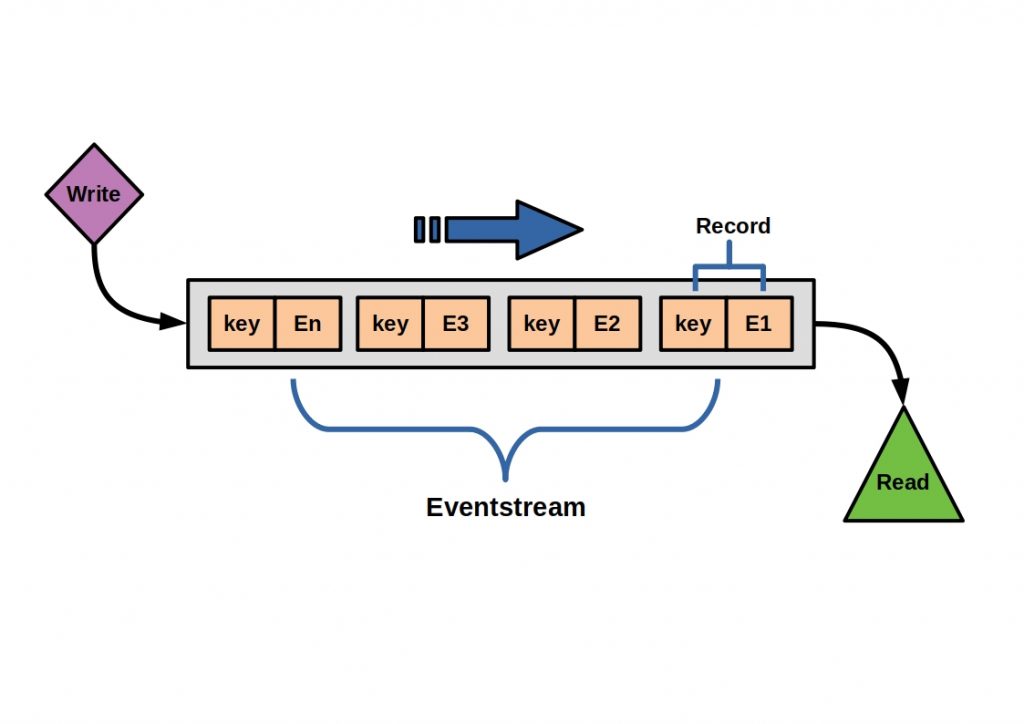
eventstreams 1
Eventstreaming

Apache Kafka

The Confluent Platform is a comprehensive event streaming platform that builds on top of Apache Kafka, a message broker that allows data to be stored in topics as logs, enabling any number of clients to subscribe and rewrite the data. Microservices can access the data streams from multiple topics with ease, and data structure remains consistent, regardless of programming languages and technology used. Confluent Platform provides additional features such as the Schema Registry, Kafka Connect, and Control Center.

Schema Registry

The Schema Registry allows for the management of schema versions for data stored in Kafka, ensuring that data is properly structured and can be easily consumed by different systems. Kafka Connect simplifies the integration of Kafka with other systems, while Control Center provides a graphical user interface for monitoring and managing Kafka clusters.
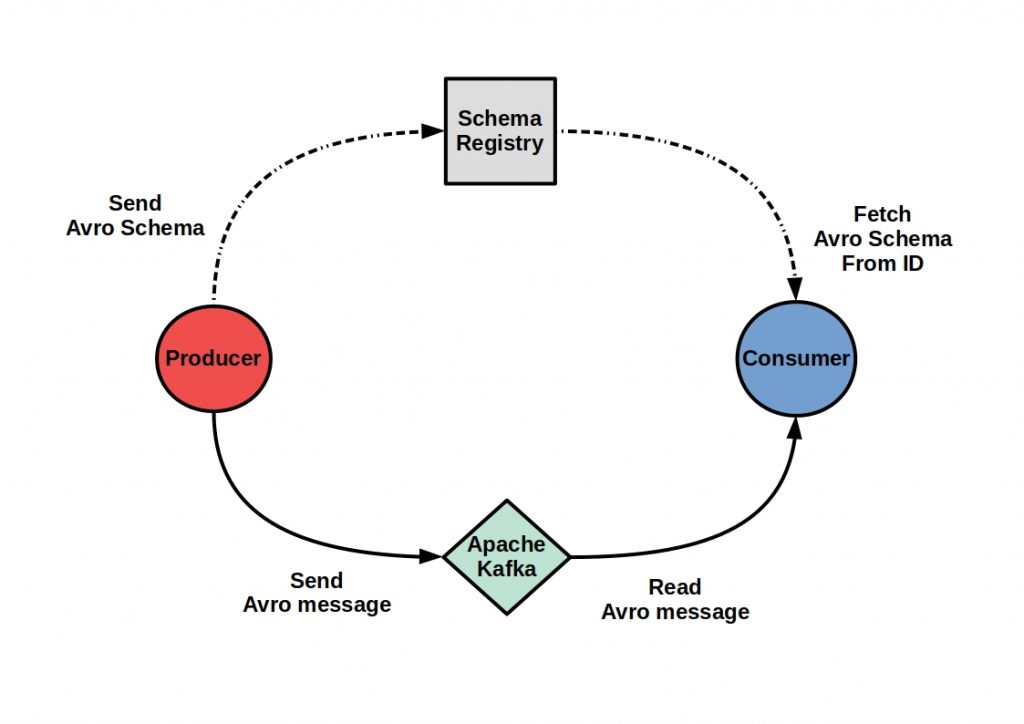
avro kafka
Schema Registry integration with Kafka and Apache Avro

Confluent tools and services

Confluent offers additional tools and services such as Confluent Cloud, a fully-managed cloud service for event streaming, and Confluent Hub, a centralized marketplace for Kafka connectors and other Kafka-related extensions. With the Confluent Platform, businesses can leverage the power of real-time data processing to gain a competitive edge in today’s market.

ksqlDB

One of the key components of the Confluent Platform is ksqlDB, an event streaming database that allows for easy transformation of data within Kafka’s data pipelines. With ksqlDB, microservices can enrich and transform data in real-time, enabling anomaly detection, real-time monitoring, and real-time data format conversion. This is made possible by window-based query processing, which allows continuous stream queries based on window-based aggregation of events. Windows are polling intervals that are continuously executed over the data streams. Several window types are available, such as Tumbling, Bouncing, and Session, and they differ in their composition to each other. In addition to continuous queries through window-based aggregation of events, ksqlDB offers many other features that are helpful in dealing with streams.

For example, the last value of a column can be tracked when aggregating events from a stream into a table. Multiple streams can be merged by real-time joins or transformed in real-time. The database is distributed, fault-tolerant, and scalable, and Kafka Connect connectors can be executed and controlled directly.
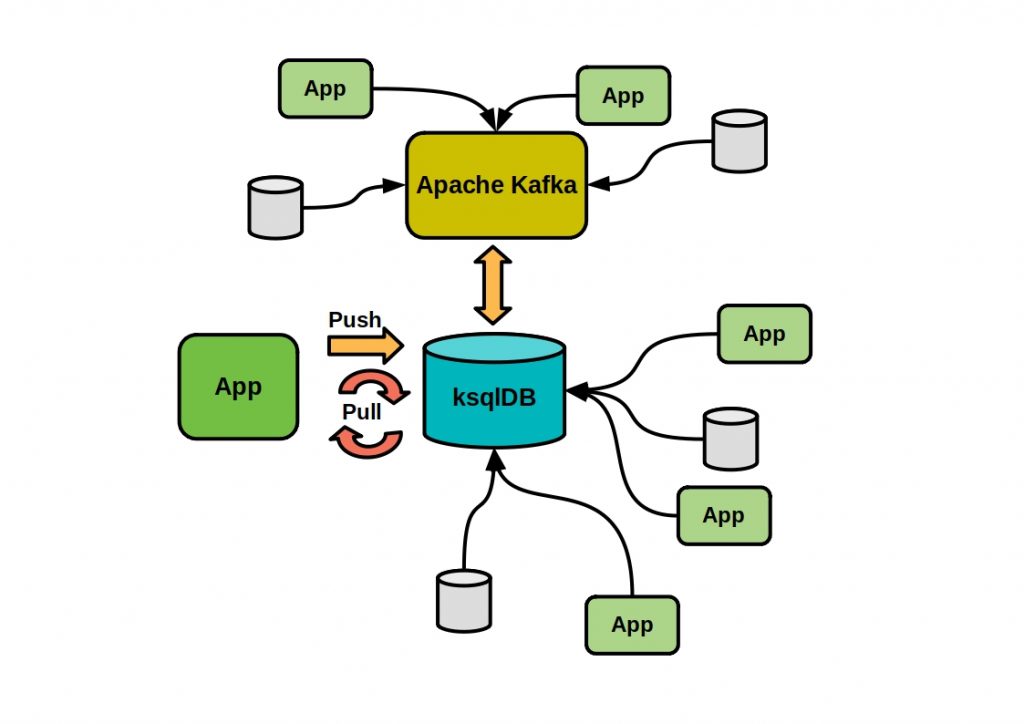
live streaming microservice architecture  with confluent
Example microservice architecture with Confluent Infrastructure: Apache Kafka – ksqlDB data stream live processing

Confluent’s event streaming database ksqlDB offers an excellent solution for real-time data stream processing with Kafka. Kafka is an ideal solution as a central element in a microservice-based software architecture. Microservices can run as separate processes and consume in parallel from the message broker, and ksqlDB ensures real-time stream processing within the services.

Conclusion

In conclusion, real-time data streaming and processing is the future of data processing, with businesses increasingly relying on this technology to gain insights from their data as events occur. Data streaming complements batch processing instead of completely replacing it. Batch processing is still used for tasks where real-time processing is not required, such as generating reports or conducting periodic data analysis. On the other hand, data streaming is used for tasks that require real-time processing, such as monitoring IoT devices or processing financial transactions in real-time. The two approaches complement each other and can be combined depending on the use case to achieve the best results. While the Confluent Platform offers a robust set of tools and services for real-time data processing, it is important to note that there are several alternatives available in the market. As technology continues to evolve, it is difficult to predict which platform or solution will emerge as the dominant player in the field. However, it is clear that real-time data processing and streaming will continue to play a crucial role in helping businesses stay competitive in today’s market.
ERP vs MES vs PLM vs ALM – What role will they play in industry 4.0?

ERP vs MES vs PLM vs ALM – These terms are being mentioned more and more often in connection with Industry 4.0. But what is behind these systems and what are the differences?

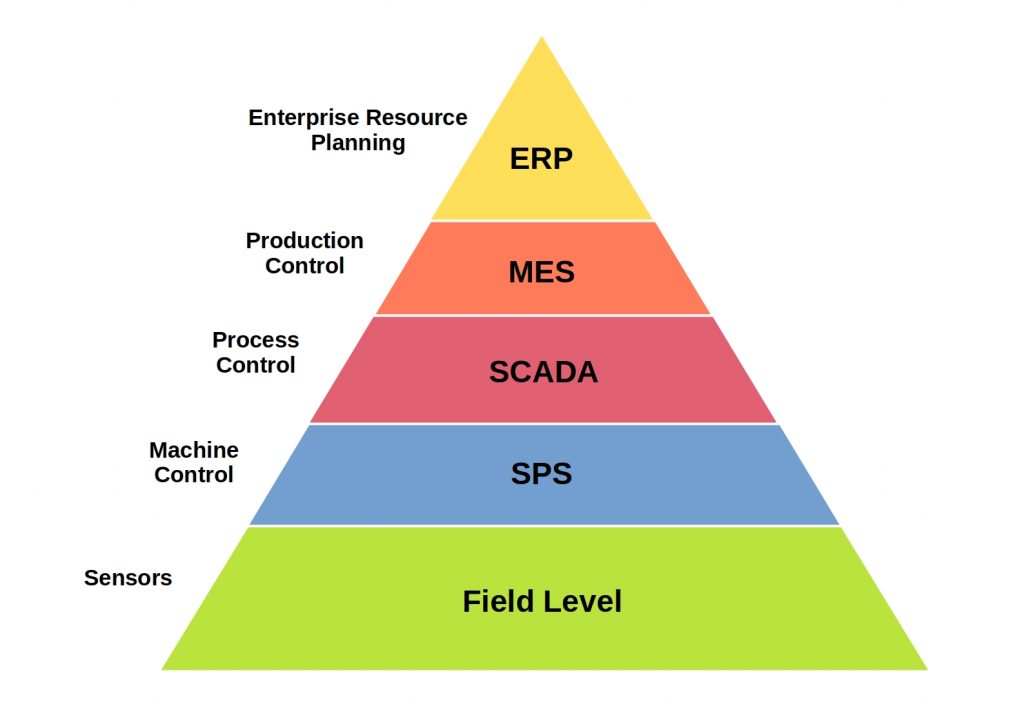
this scheme gives an Example of a business process pyramid
Example of a business process pyramid

To stay competitive in today’s world, you need to increase the efficiency of your business processes. It is important that you optimally plan, control and manage your operational resources (capital, personnel…).

Your goal should be to create high quality and continuity with high productivity and low lead time.
Many of your business processes create ever larger amounts of data and increase in complexity. You need to reduce this complexity and increase your flexibility.
Many software solutions are available to your company for the optimal use of resources.

What is an ERP?

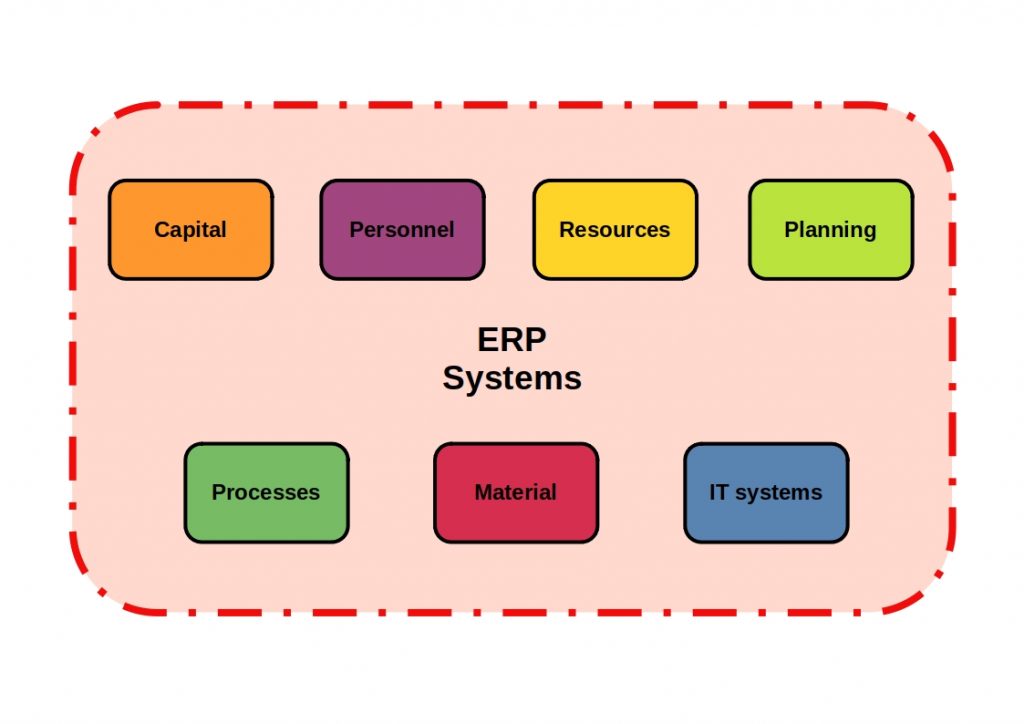
Basically, an ERP system is an IT-supported system of software solutions that communicate with each other. Your data is stored centrally and should represent your company in its entirety through quickly available information.

This scheme gives xou an overview about the ERP systems
ERP vs MES vs PLM vs ALM – Overview ERP Systems

The information of your business processes is optimized and documented.
The trend is towards web-based applications.

This means that you access the system interface via your browser and that you can also access it beyond the boundaries of your company. Another advantage is that you don’t have to install any services, making you hardware-independent.

What are ERP Subsystems?

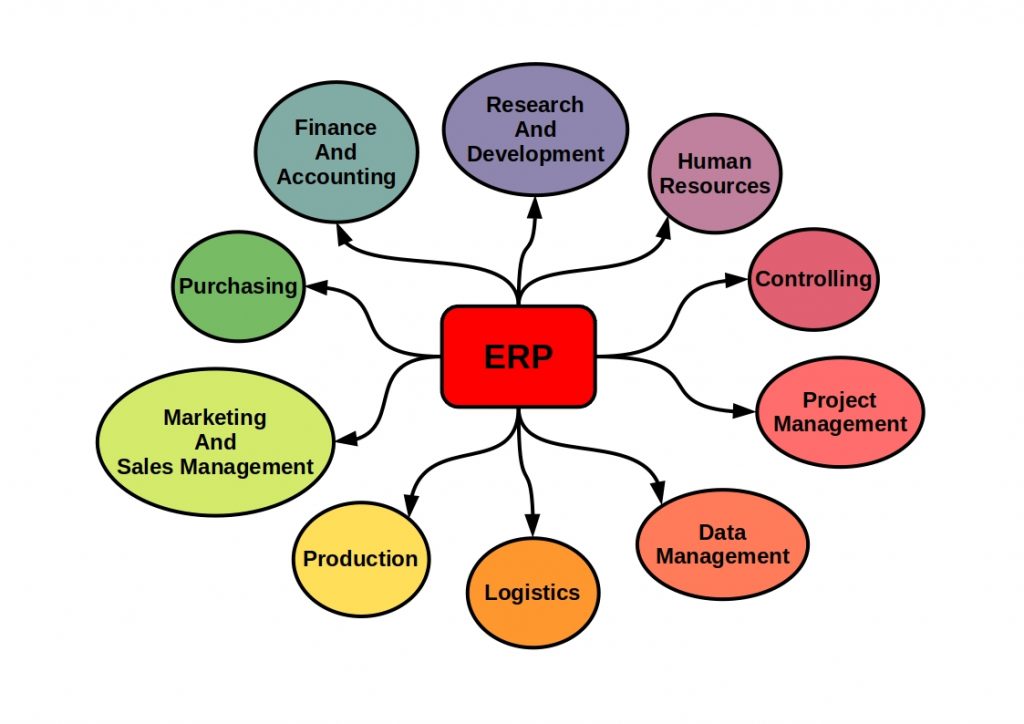
You can use ERP systems in all areas of your business. They provide you with complete solutions for all necessary subsystems.

This scheme shows the ERP fetures
ERP vs MES vs PLM vs ALM – ERP features

Complex systems are divided into so-called application modules, which you can combine with each other as you wish. These fulfill various tasks for the provision and further processing of information. In this way, you can put together your ERP system according to your requirements and adapt it to the size of your company.

What is Advantages Cloud ERP?

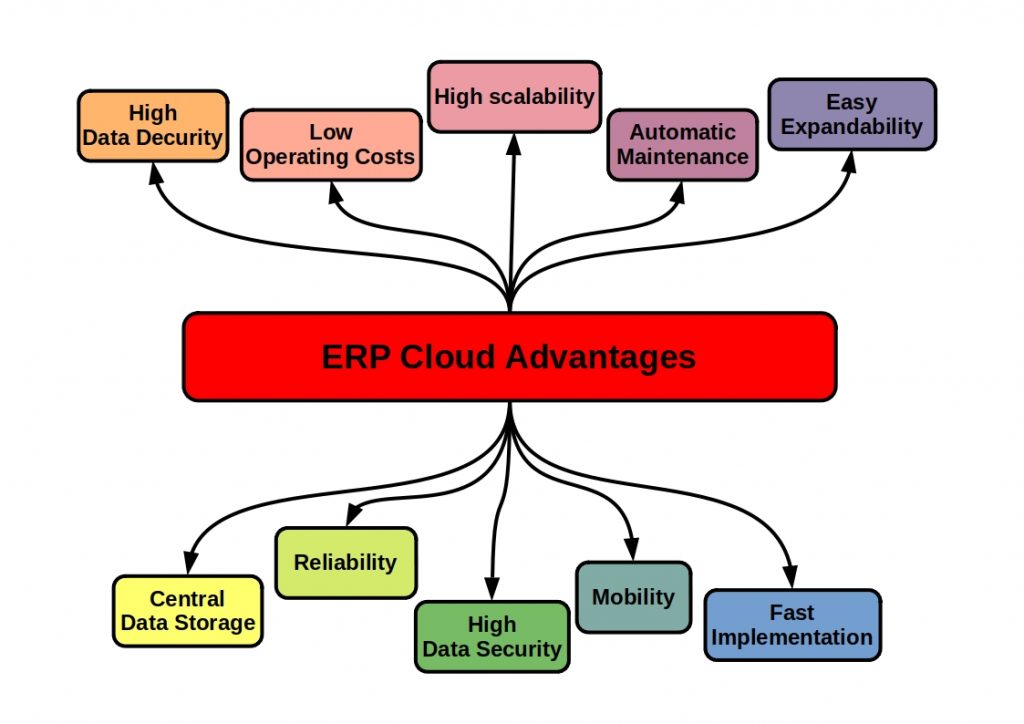
ERPs can also be purchased as a complete Software-as-a-Service (SaaS) solution.

This scheme shows the ERP Cloud Advantages
ERP vs MES vs PLM vs ALM – ERP Cloud Advantages

These are comletely industry and hardware independent. You, as a user, can access a sophisticated ERP software package online and thus from anywhere. This gives you absolute spatial flexibility. However, Cloud ERP solutions are still quite new and not yet fully mature. So you should weigh up well in advance whether you want to use a cloud application.

What is an MES?

The MES system is an operational process-related part of a multi-layer MES System. It is responsible for real-time production management and control. You can use MES data to optimize manufacturing processes and detect errors during the production process.

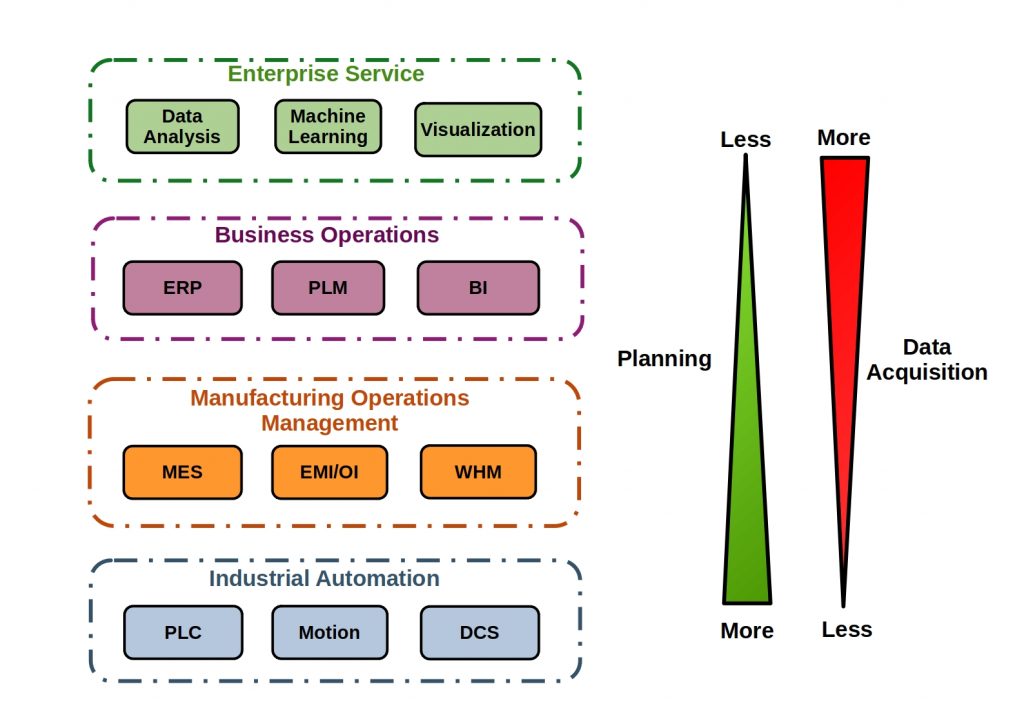
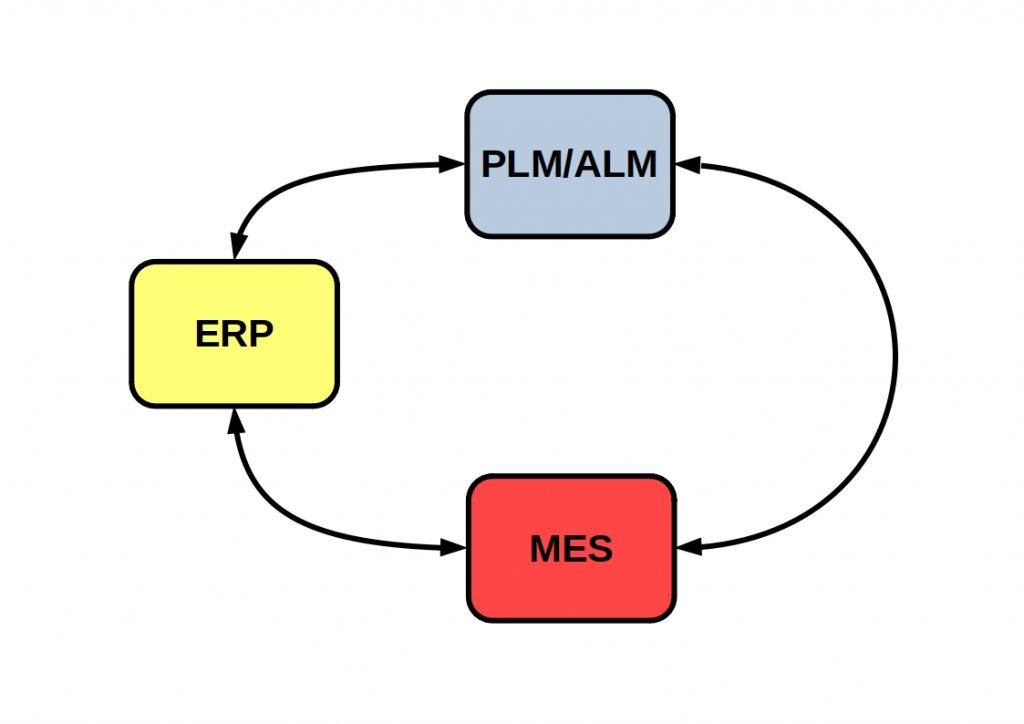
The MES system is assigned to the ERP system. This system accesses your MES data to plan production. It then feeds this information back to your production control system for implementation.

Relationship between company level
ERP vs MES vs PLM vs ALM – Relationship between company level


The interaction of the individual components is moving closer together in Industry 4.0. 

What does the MES include?

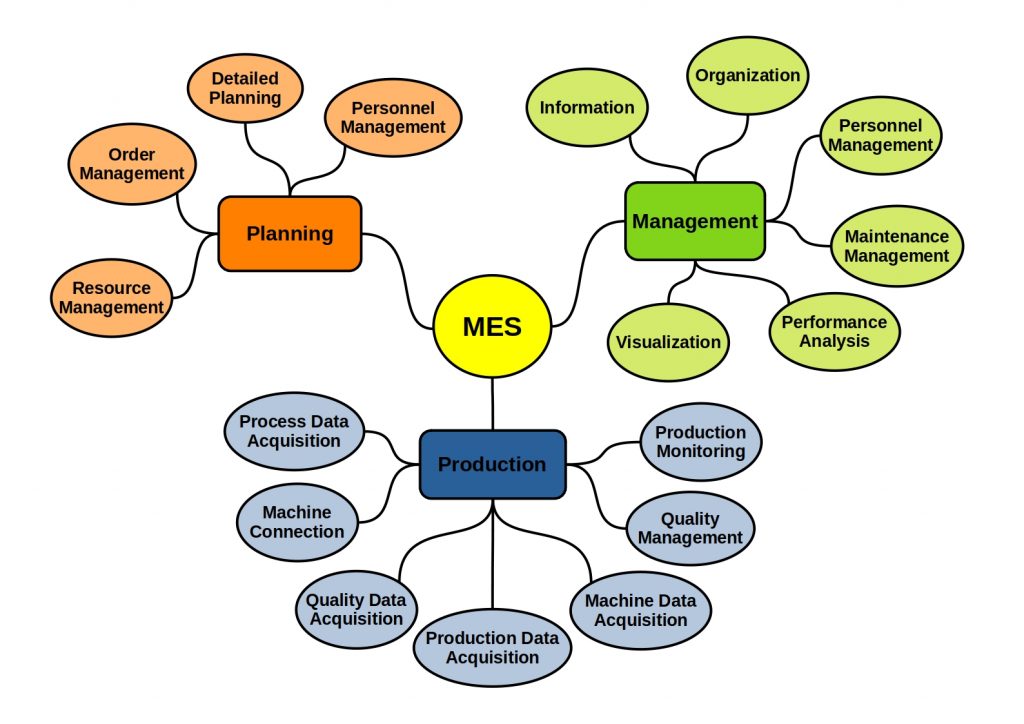
MES is usually a multi-layer overall system. It processes your production data into Key Performance Indicators (KPI) and enforces the fulfillment of an existing production plan.

this diagram clearly shows all components of a MES System
ERP vs MES vs PLM vs ALM – MES System features

It processes your production data into Key Performance Indicators (KPI) and enforces the fulfillment of an existing production plan.

What is an PLM?

In addition to MES and ERP, the Product Life Cycle Management (PLM) system plays an elementary role in the digitization of your company.

In order for your company to remain internationally competitive in today’s world, you need to optimize your business models in order to be able to act preventively.

As a manufacturing company, you need to be able to analyze large amounts of data quickly. This way you can recognize deviations from the plan early on and make the right decisions.

Many software solutions help you in all business areas and even exchange data with each other. In this way, you can create information chains within a company and act more quickly. 

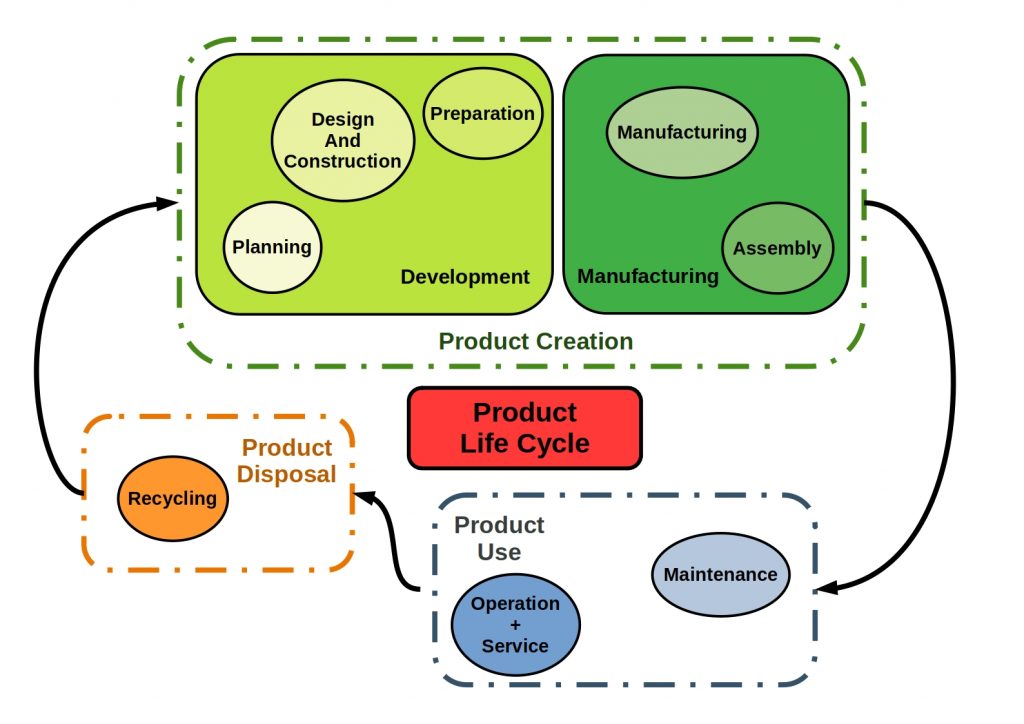
PLM System is a management approach for the seamless integration of all information that accumulates during the life cycle of a product.
The core components of PLM are the data and information related to the product lifecycle.

this scheme shows your production life cycle process
ERP vs MES vs PLM vs ALM – Production life cycle process

A large amount of product-related and time-dependent data is generated along the product life cycle. The PLM enterprise concept is based on coordinated methods, processes and organizational structures and usually makes use of IT systems. PLM tools link design, implementation and production and provide feedback from manufacturing.

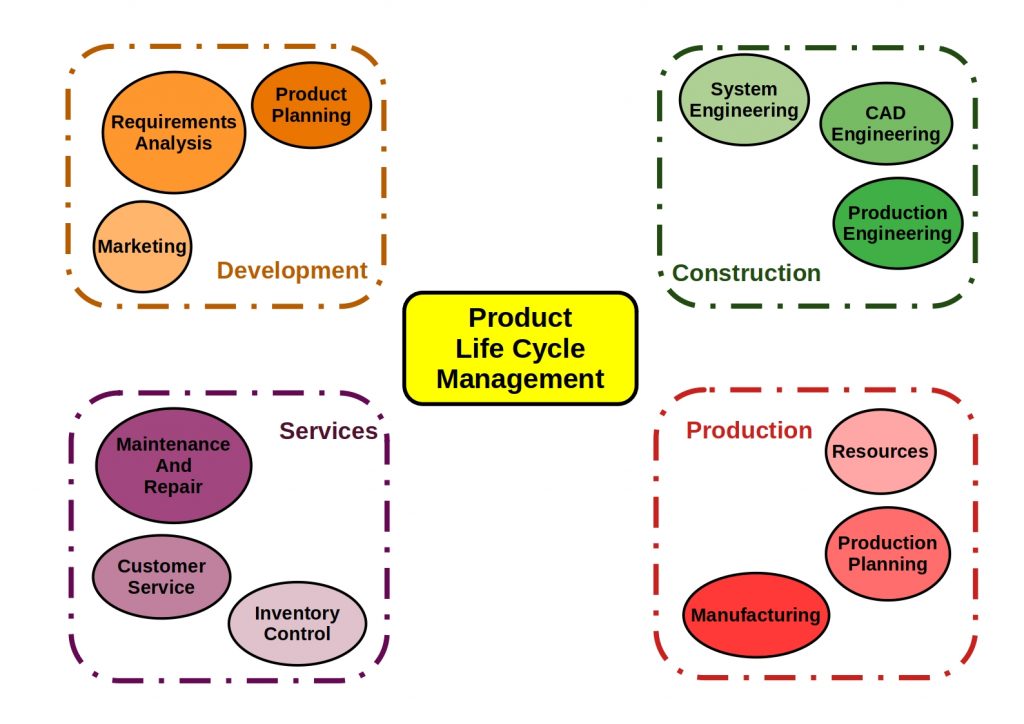
this scheme shows PLM main application areas
ERP vs MES vs PLM vs ALM – PLM main areas of application

The goal of a PLM system is the central management of information and corresponding user groups. One advantage here is that you can control the process of editing and distribution throughout the company.

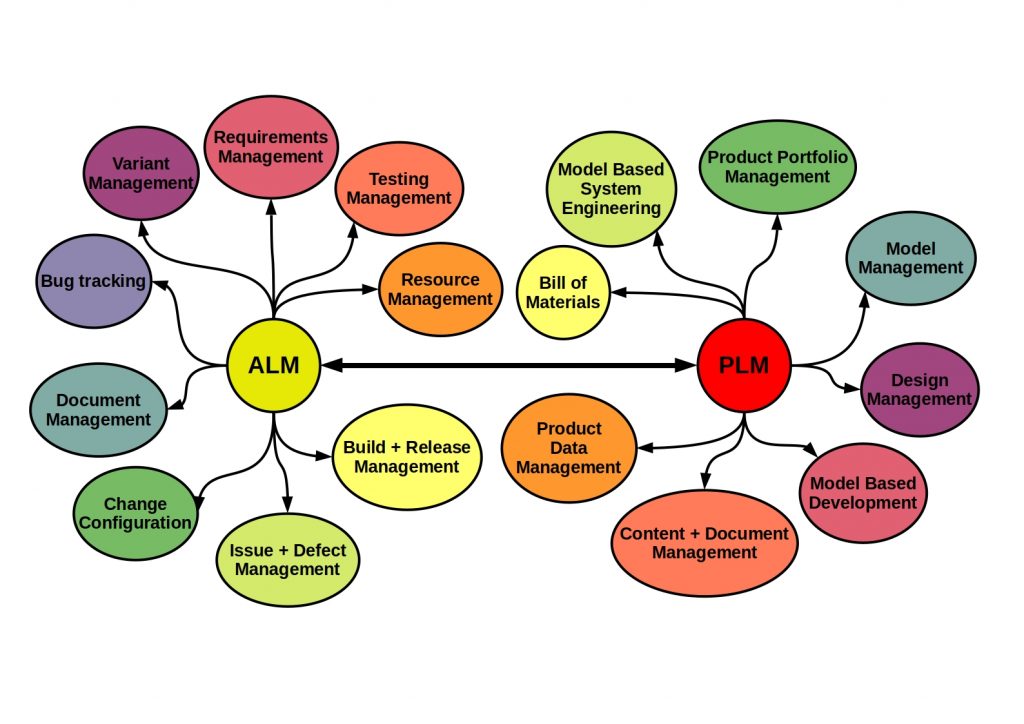
Application Lifecycle Management (ALM) vs PLM System

More and more products and systems now contain a software component. However, since hardware and software are historically different, you must also differentiate between the management systems.

This schema shows the major differences between ALM and PLM
ALM vs PLM


With PLM you are looking at a physical product, with ALM you are looking at a software product. Basically, however, there are similarities between the two systems. Both also track a product over its entire lifecycle. However, since both product types are increasingly merging today, you can also link both systems on an IT basis at the overall product level.

ERP vs MES vs PLM vs ALM – What does the future hold?

When people talk about Industry 4.0, they are referring to a new level of technological progress. The basis of this innovation is the Internet of Things (IoT). The software solutions of various company levels are networked to form cyber-physical systems and exchange information with each other in real time. In this way, production planning can take place in management and be implemented directly in production. As production becomes more complex in the future, mastering complexity and complex technologies will come with the necessary know-how.


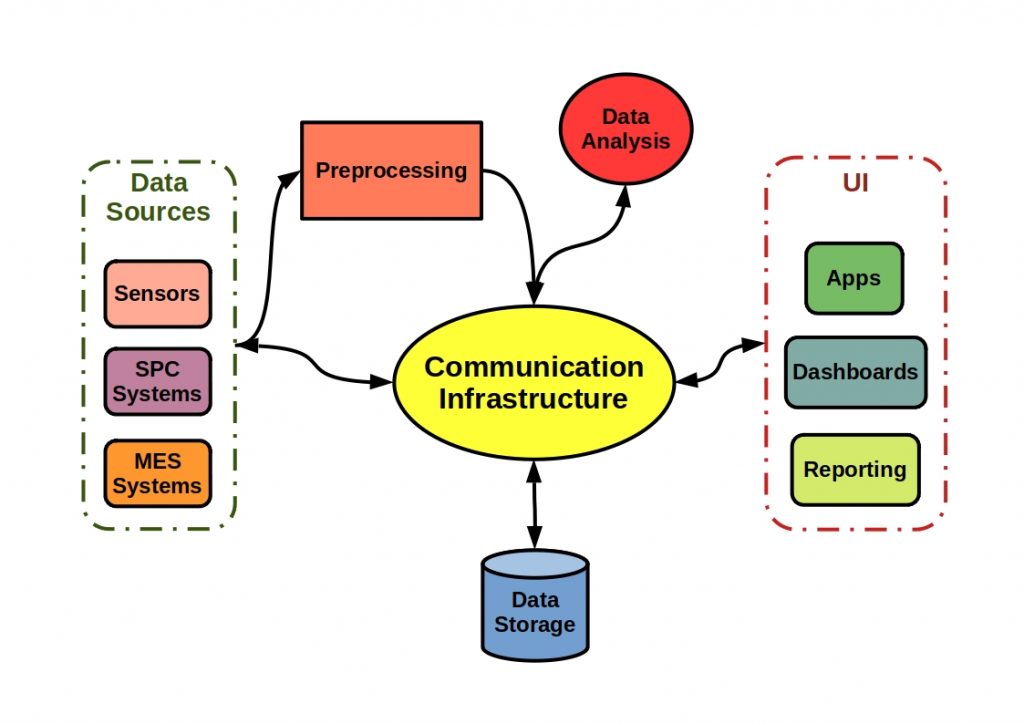
The software solutions presented here are systems optimized for business areas. Each software system is therefore an expert in its own field. This ensures a decisive modularity for a company’s overall solution. On the other hand, this modularity always leads to increased complexity. In the future, it will become increasingly important to create reciprocal data pipelines, so-called data streams, between the individual systems, which currently still operate very autonomously.

ERP vs MES vs PLM vs ALM - This schema shows their roe in industry 4.0
ERP vs MES vs PLM vs ALM – And their role in Industry 4.0

A decision made at the management level should be implemented in production and at the same time remain controllable at all levels. Optimally, the system should be able to make its own analyses. AI algorithms can help here to find sensible decisions despite increasing complexity. This allows you to optimize your individual production steps and shorten life cycles.

This schema shows the role of a MES System in Industry 4.0
ERP vs MES vs PLM vs ALM – Industry 4.0 and MES System

The MES, for example, plays an important role here due to its proximity to production. This allows you to make important decisions quickly and implement production plans.In your company of the future, software solutions from various divisions are networked with each other. So you can form information chains and the MES is part of this network.

TensorFlow or Theano?

TensorFlow or Theano – TensorFlow, along with PyTorch, is currently the best known and most widely used machine learning framework. However, the choice of tool should never depend on one’s own preferences, but should be adapted to the data to be examined. Especially in the Big data area, this can prevent a decisive loss of performance. It is therefore also worthwhile to look off the beaten track and to look at other frameworks and libraries in addition to the top dogs.
Theano is one such open source Python library. In the following article, we will introduce both tools and explain the differences.

What is Tensorflow?

The open source framework TensorFlow is the direct successor of Google’s first deep learning tool DistBelief and primarily also forms the basis for neural networks in the environment of language and image processing tasks. With TensorFlow, own models can be developed and processed, but also pre-trained models can be accessed. TF runs on a variety of platforms and is implemented in Python and C++.

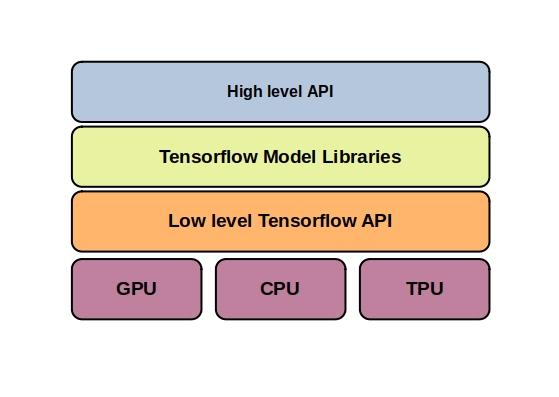
TensorFlow vs Theano - This figure shows the hierarchy of the TensorFlow framework.
Hierarchy of TensorFlow toolkits

TF offers low-level APIs for CPU, GPU or TPU. In this way, the hardware resources can be optimally adapted to the process through dynamic allocations.
In addition to the low level APIs, there are also various high level APIs, such as Keras, one of the best known and most frequently used. If you want to know more about Keras, check out our article on the topic.

Framework Architecture

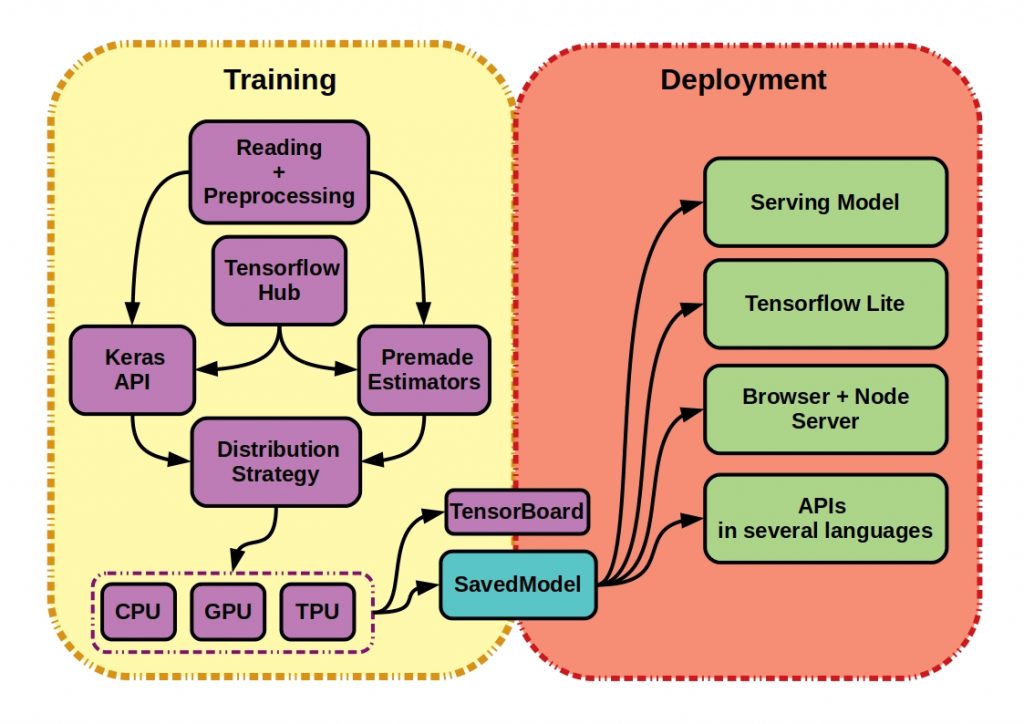
Mainly, the TensorFlow framework can be divided into the components needed for training, where the models are prepared for field use, and for the final deployment, for example on mobile and IoT devices with TensorFlowLite. To simplify the training, TensorFlow offers the developer some useful services besides the already mentioned dynamic allocation. For example, a premade estimator offers a high-level representation of a complete model.Via the TensorFlow Hub, a kind of repository, even trained machine learning models can be other language bindings can be accessed.

TensorFlow vs Theano - This figure shows the structure of the TensorFlow framework.
TensorFlow or Theano – Structure of the TensorFlow Framework

The TensorBoard and StoredModels services act as connecting elements between training and deployment. TensorBoard is the visualization toolkit of TensorFlow with which the experiment results can be visualized. So here it is more of a monitoring solution for the human interface. With the StoredModels both deployment services and training services can share the models. This service thus forms a kind of intermediary, but contains a complete TensorFlow program, including all weights and calculations.

TensorFlow – Data Structure

Neural networks are represented by directed cycle-free graphs. These graphs can be represented and computed beyond the computer limits of training. A graph basically consists of nodes connected by edges. The extent to which the nodes are interconnected also usually determines the learning procedure and thus the structure of an artificial neural network.
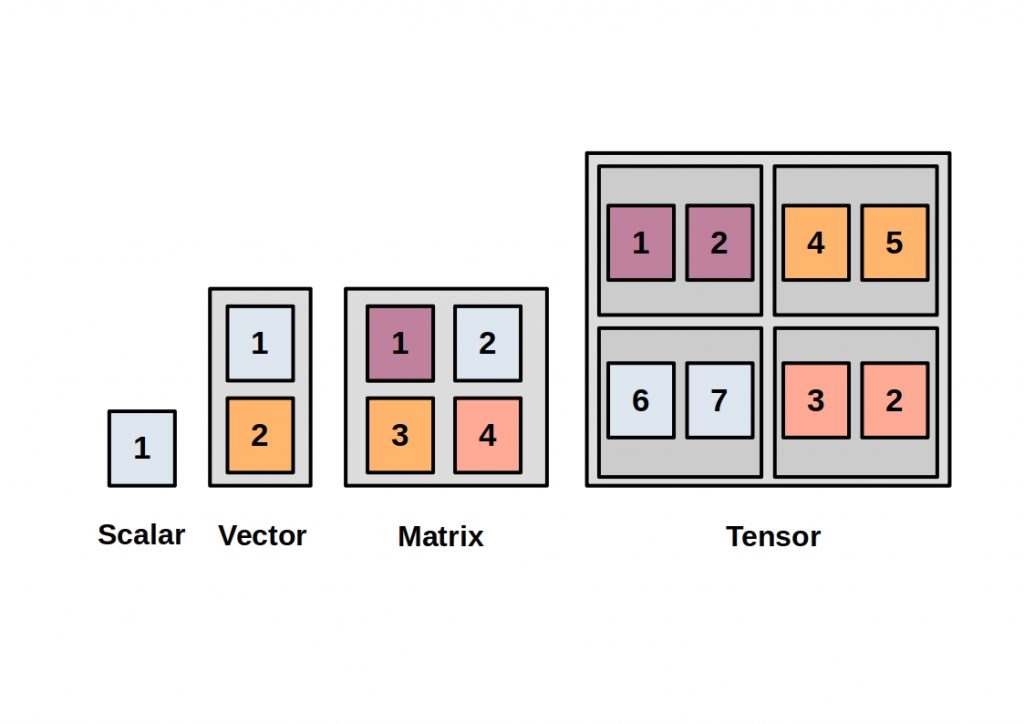
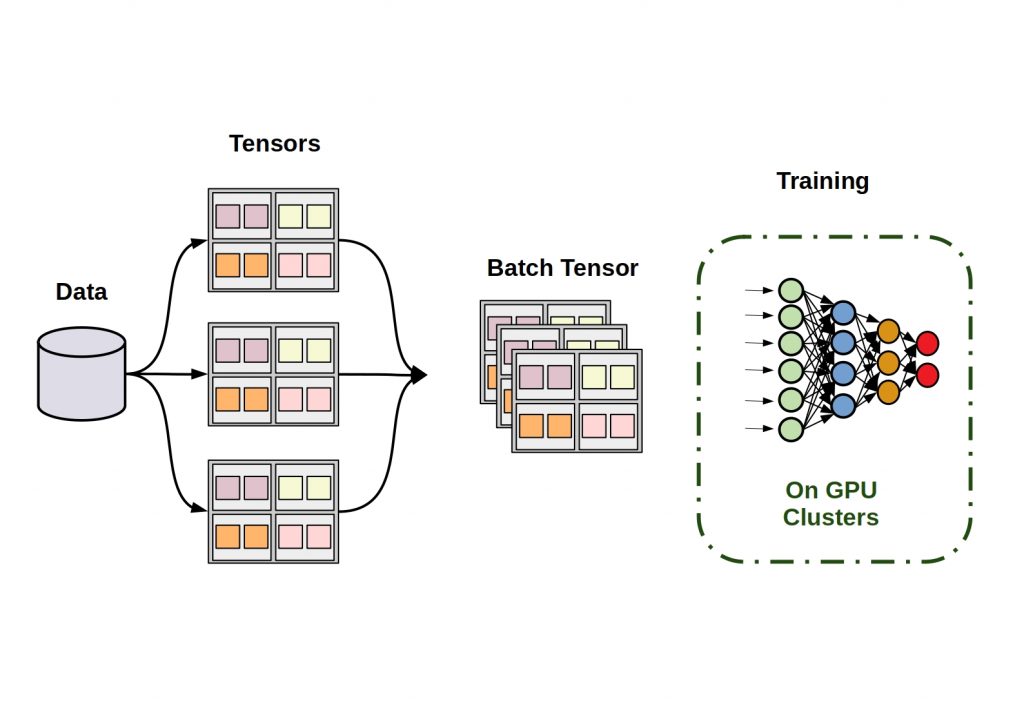
The inputs and outputs of the individual calculation steps represent multidimensional data arrays, so-called tensors.

This figure shows the basic tensor structure
Tensor Principle

The mathematical term tensor corresponds to a generalization of vectors and matrices. It is thus an elementary data structure for data representation and processing. In TensorFlow the implementation is done as multidimensional arrays . A vector thus corresponds to a one-dimensional tensor.
Additional dimensions can be added to a tensor up to infinity. Common tensor types are 3-dimensional tensors for time series, images are usually 4-dimensional, and videos are 5-dimensional tensors.

pytorch training 2
Tensors and neural networks

TensorFlow methods manipulate tensors for linear algebra operations. These processes can be executed with high performance by moving the tensor objects to the graphics card memory or tensor optimized TPUs.

TensorFlow – Training

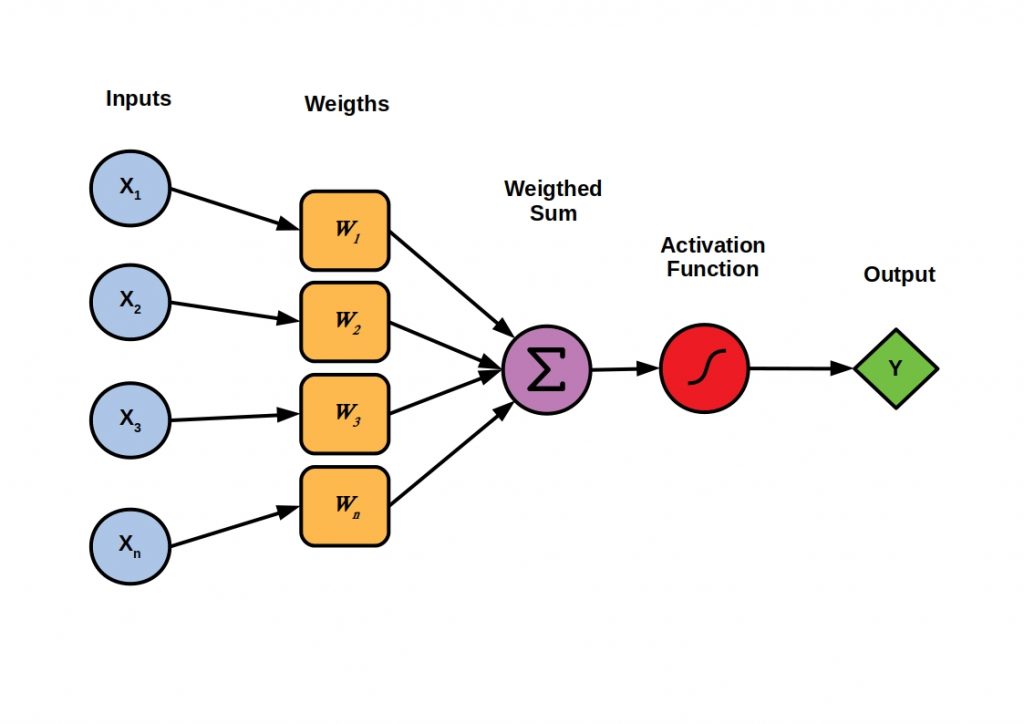
The training itself then proceeds in such a way that training data are iteratively fed into the computers and at the same time the weights within the graph are varied. The output is then approximated to a target output value. To this end, separate test data can be used to periodically verify that the training is effective for arbitrary or different input data.

 The figure shows the sequence of the training of a neural network
Training procedure

Theano – Old but Gold

Theano is an open source Python library for machine learning and neural network programming, and compiler for mathematical expression computation. It was released back in 2007 by the Montreal Institute for Learning Algorithms (MILA) at the University of Montreal.
It is particularly suitable for the definition, optimization and evaluation of mathematical expressions involving multidimensional arrays. For this purpose, Theano accesses the NumPy program library for dealing with matrices, large multidimensional arrays and vectors. First, read our article on NumPy. Here we introduce you to this elementary Python library and explain its basic data management.


Mathematical expressions are programmed and symbolized in Theano using a NumPy-like syntax.
The calculation instructions are done in C++ or CUDA code, thus very close to the machine and accordingly very efficient on CPUs or graphics processing units (GPUs).
Theano can also be used, like TensorFlow as a backend for the framework Keras. Keras thus forms an intersection for both technologies.

Graph Structure

Unlike TensorFlow, Theano focuses on supporting symbolic matrix expressions rather than tensors as a basic data type. Although all kinds of Python objects are supported, basic tensor functionality can be used with Theano, but these operations are not as optimized as with TensorFlow.

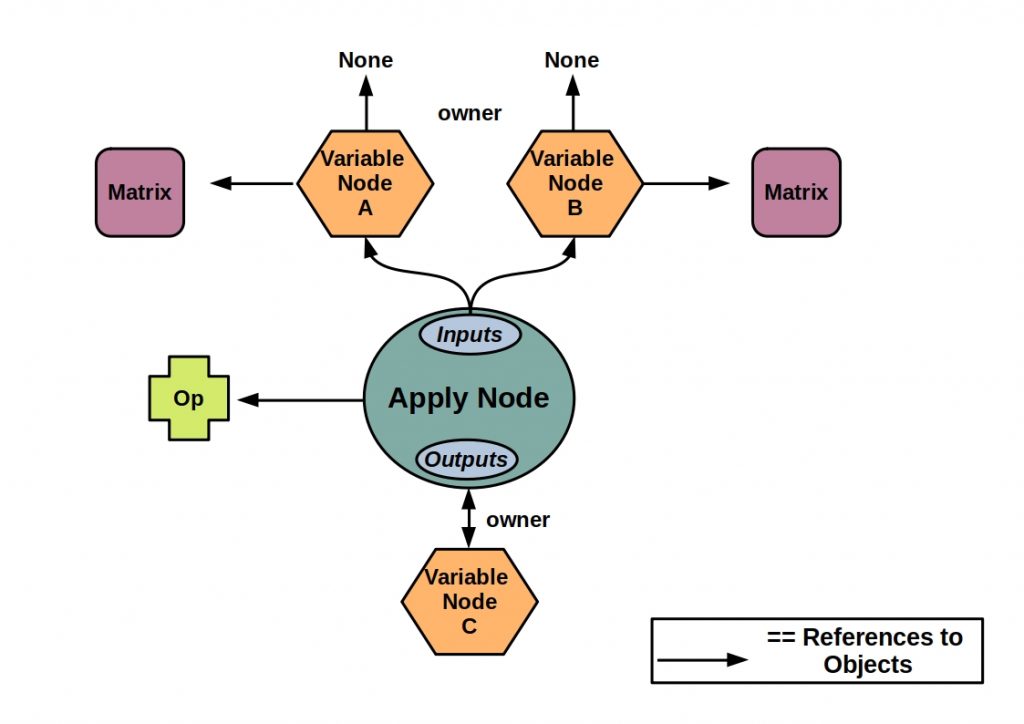
Theano performs the symbolic mathematical calculations are executed as graphs. These graphs are composed of interconnected Apply, Variable and Op nodes.

TensorFlow vs Theano - Overview structure of a Theano graph
TensorFlow or Theano – Overview structure of a Theano graph

The Op node represents a particular computation on a particular type of input that produces a particular type of output. It thus corresponds to the definition of a computation.


The centrally located Apply node represents the application of an Op to some variables, that is, the application of computations to the current data, and is used to represent a computation graph. Each op is responsible for knowing how to build an Apply node from a list of inputs and thus determines the determines the function and transformation.
An Apply node additionally consists of the input or output fields. The inputs represent the arguments of the function, and the outputs represent the return values of the function.

The Apply nodes then refer to their input and output variables, the main data structure, in the graph via their input and output fields, respectively.
These Variable Nodes are defined by various fields. The variable type, the owner, which can be None or an Apply node of which the variable is an output, the index and the variable name.

TensorFlow or Theano?

All in all, both technologies have their advantages and disadvantages. But both have their raison d’être. Here, too, the data set provides the tools.

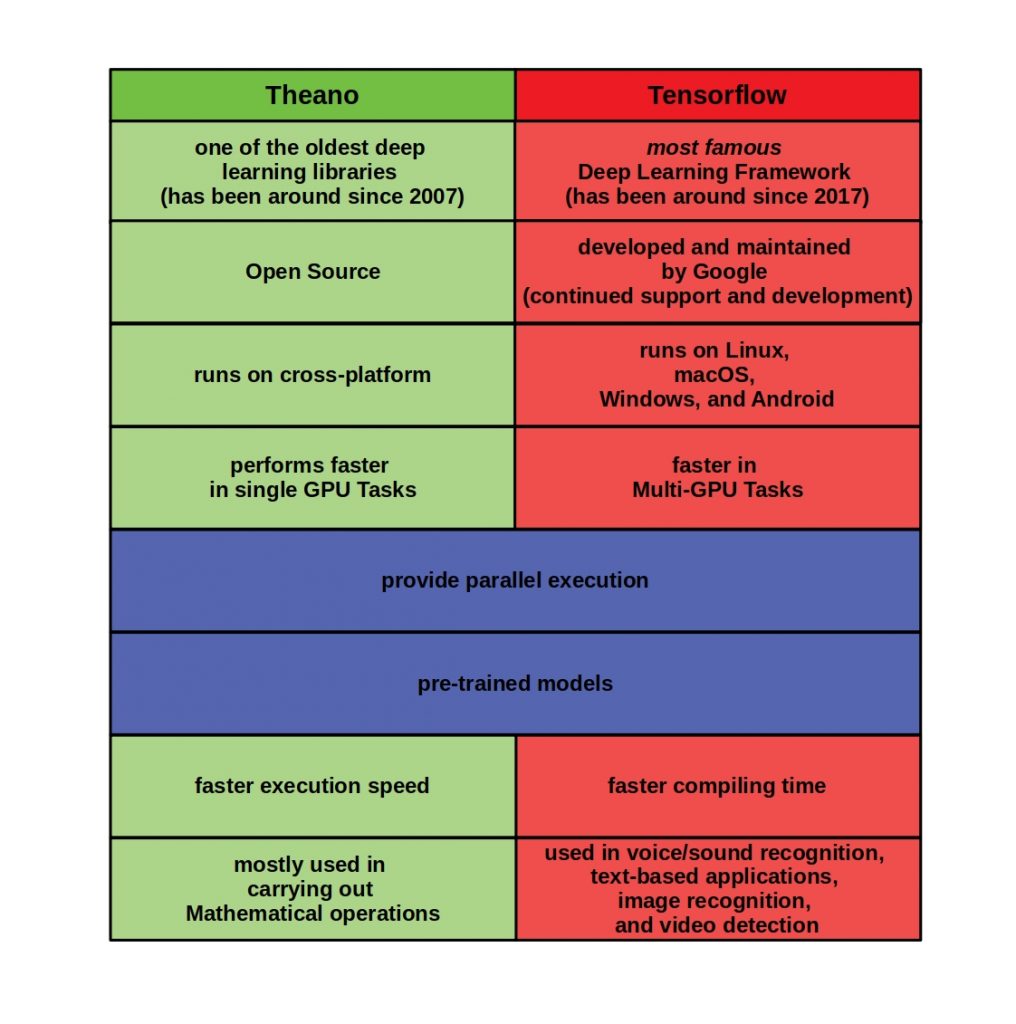
In the table below, we have listed all the important points of difference in detail.

TensorFlow vs Theano - This table compares both tools in detail.
TensorFlow or Theano – Comparision

Especially when it comes to tensor processing, as in image processing and sound recognition, TensorFlow with its optimized operations should be the first choice. Another tensor-based alternative to the Google solution is PyTorch from Facebook. In this article we compared these two tools.
Despite its age, Theano is a high-performance and modern alternative for the calculation of matrix expressions.

Apache Hive Architecture – Data Warehouse System for free

Apache Hive Architecture – On the way to Industry 4.0, companies are trying to record all business processes as far as possible in order to subsequently optimize them through analysis.
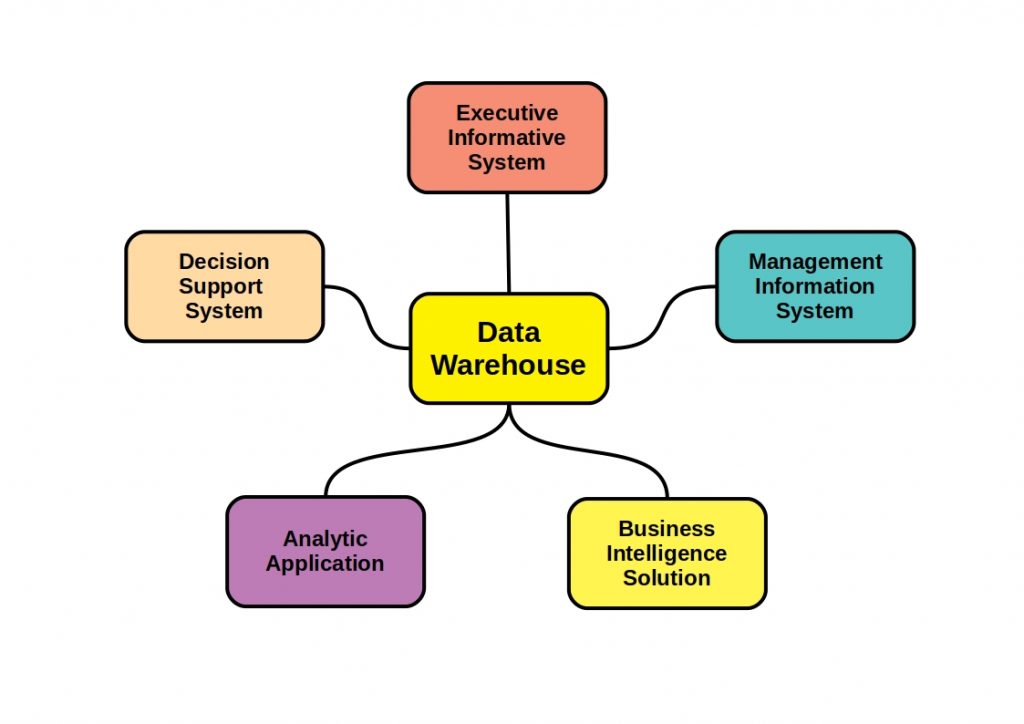
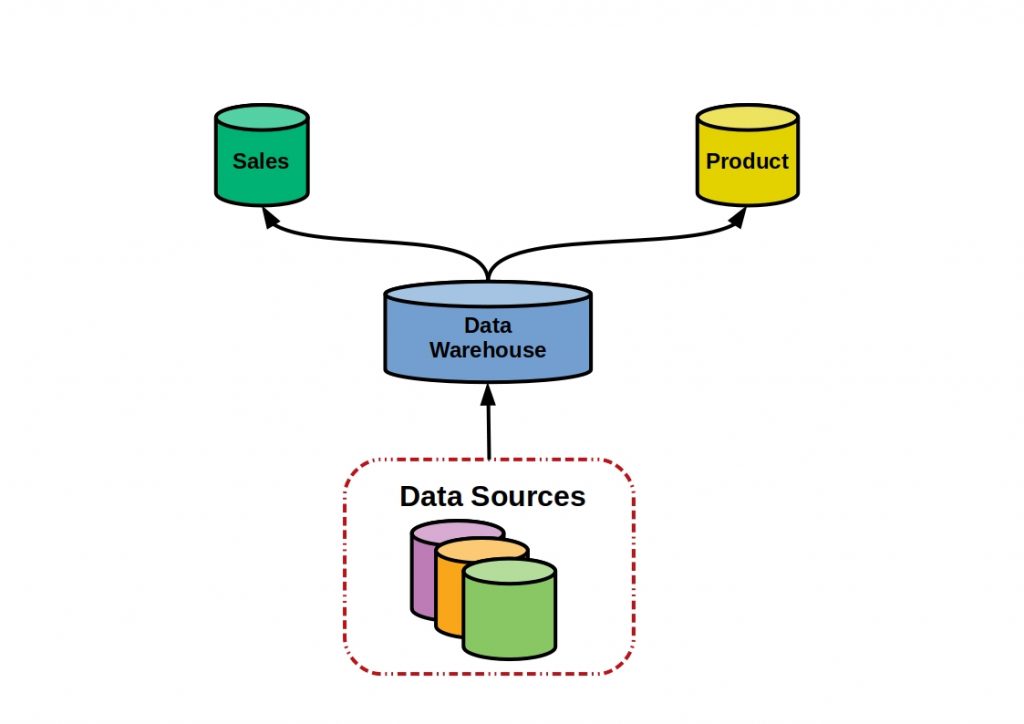
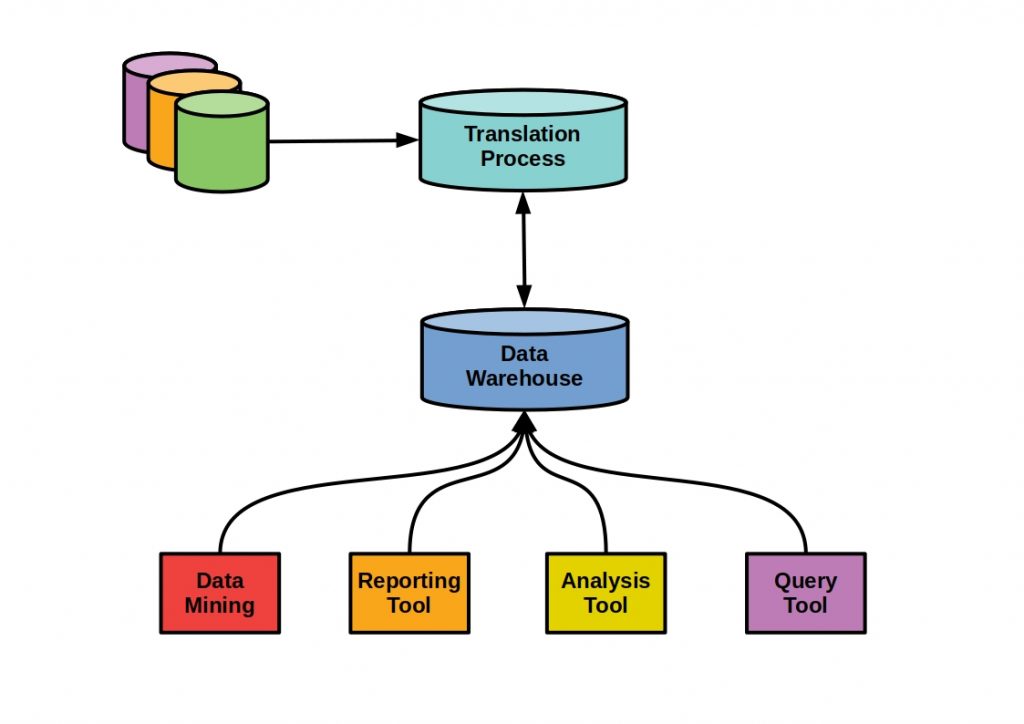
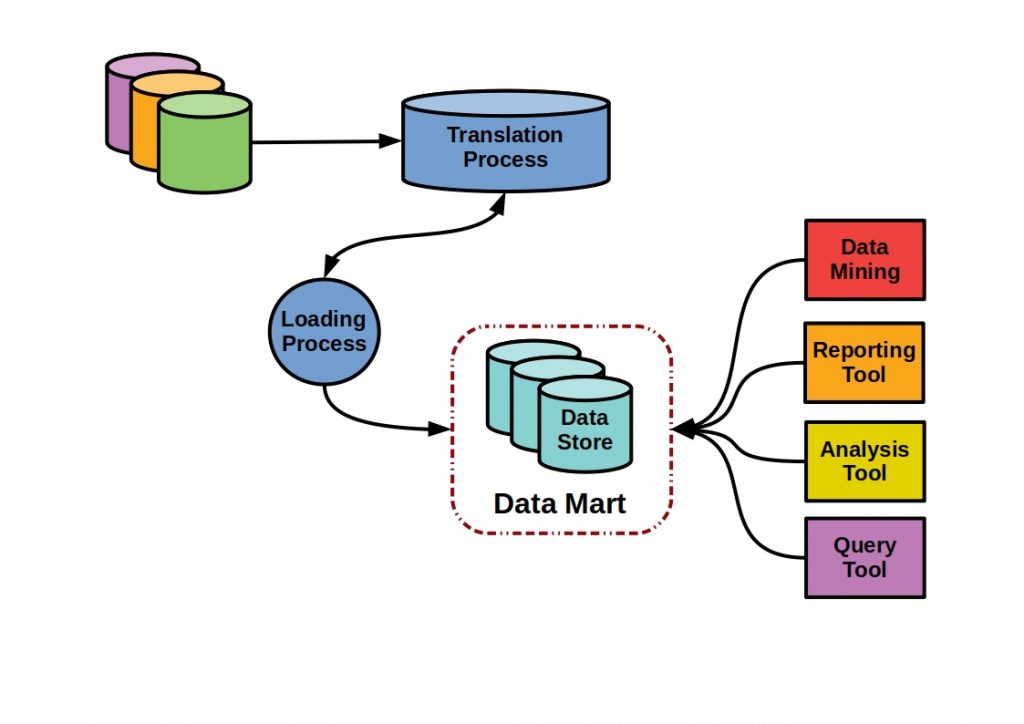
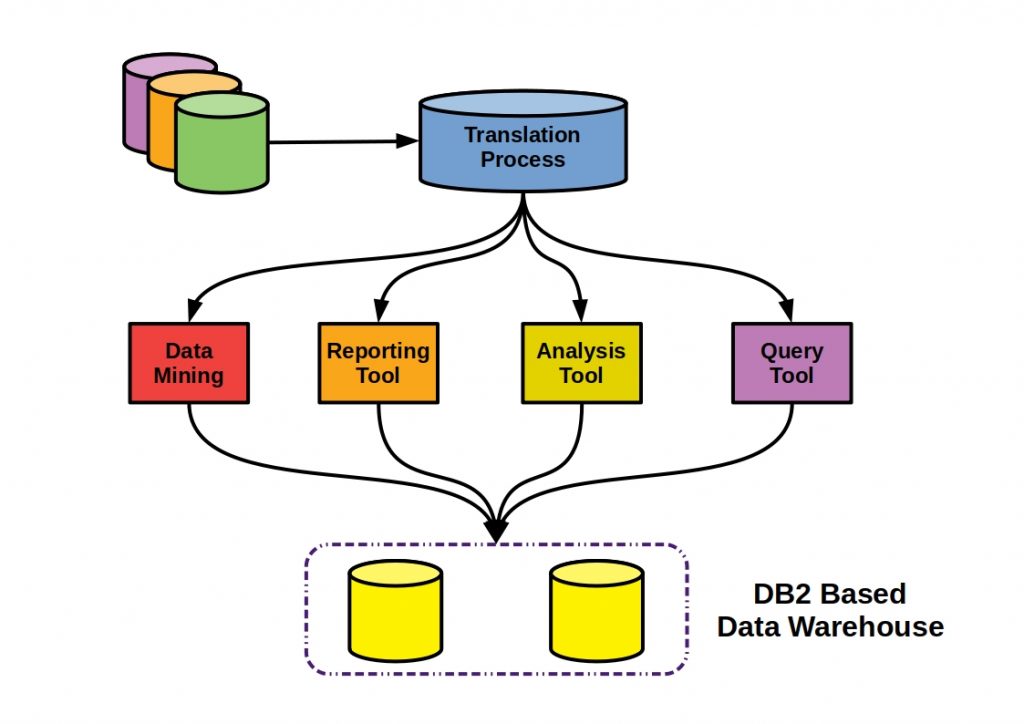
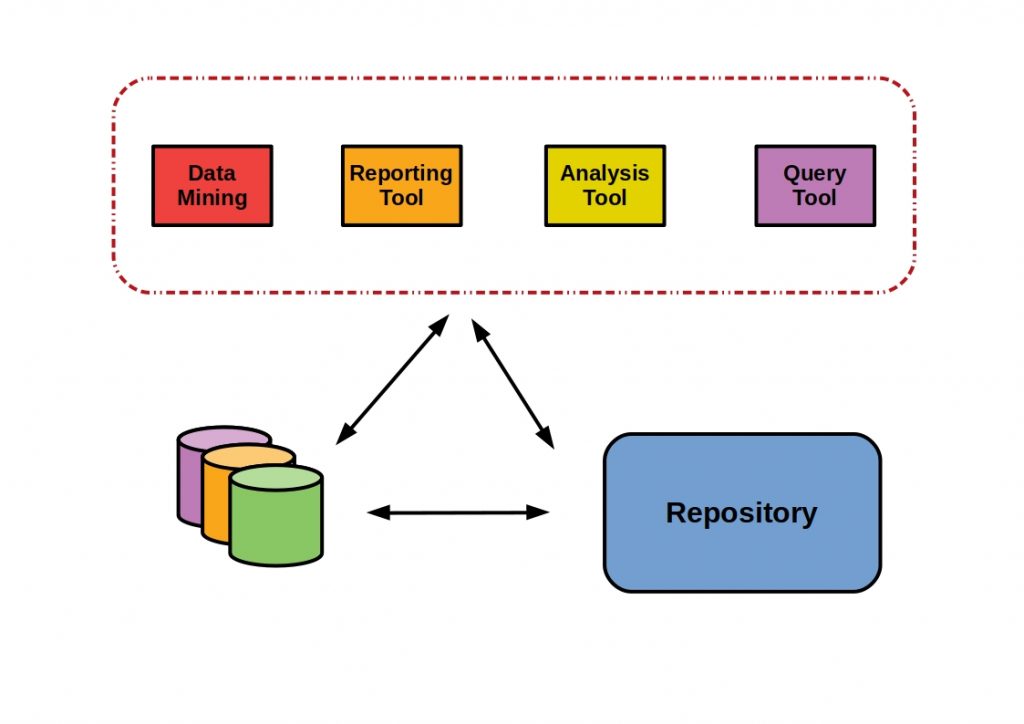
Data warehouse systems provide central data management. Thus, only one data truth exists. In addition to persistence, these information systems take care of sorting, preprocessing, translation and data analysis.
If you want to know more about what a data warehouse system is, check out our article on the subject.

What is Apache Hive

Hive is a data warehousing software project and part of Apache, an open source and free web server software. Learn more about Apache here.
It is built on the Big Data framework Apache Hadoop and was released in 2010. Since then it has been continuously improved and extended by an industrious community.

hive
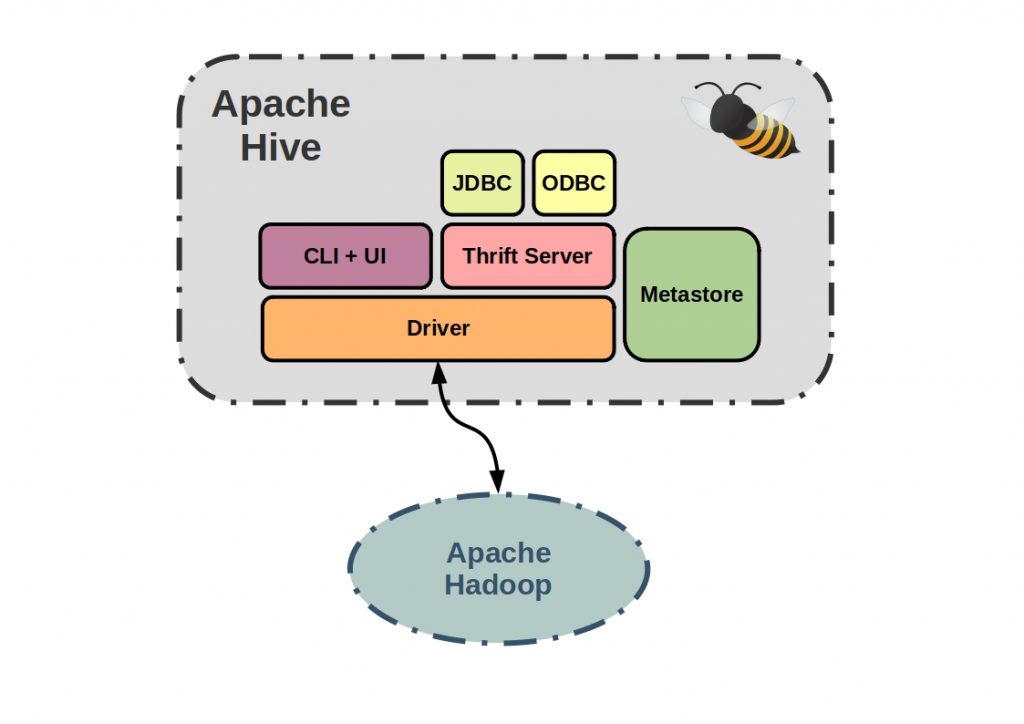
Apache Hive Architecture – Built on top of Hadoop

The query language used by Hive, called HiveQL, is SQL based and allows querying, aggregation and analysis of unstructured data. Hive does not work with the schema-on-write (SoW) approach like relational databases, but uses the so-called schema-on-read (SoR) approach.

What are the biggest advantages of Hive?

Data from relational databases is automatically converted into MapReduce or Tez or Spark jobs. Hadoopclusters are based on MapReduce, a Google programming model for concurrent computation on computer clusters, and powerful stream-based data analysis pipelines can be created with Apache Spark. This ensures full compatibility with the Apache ecosystem, which can be modularly tailored to the needs of an application.

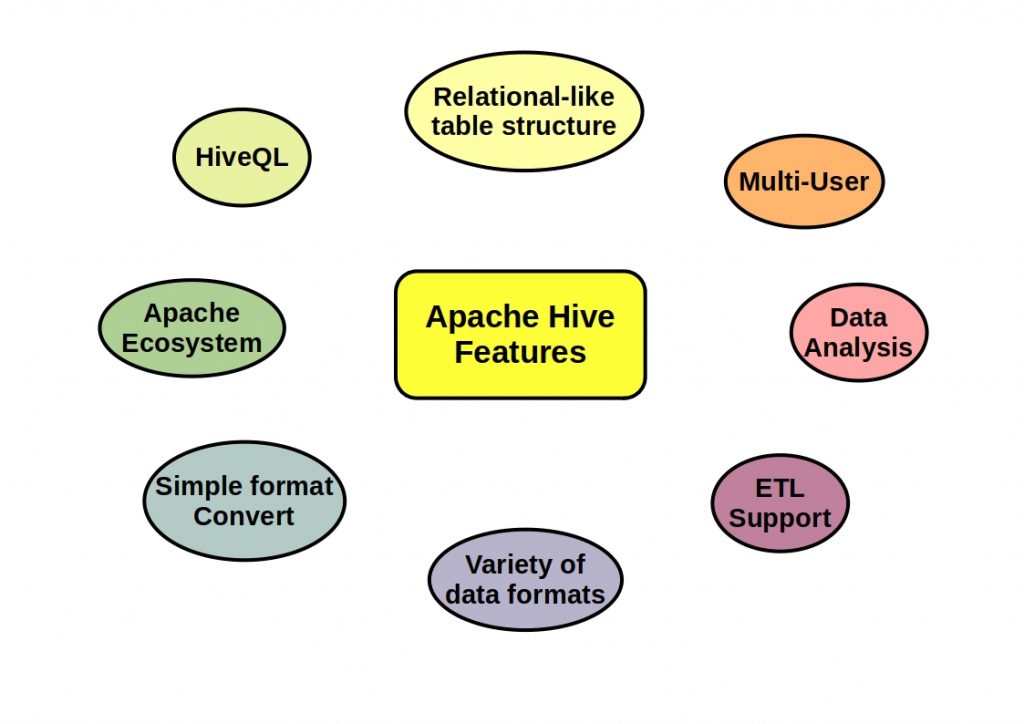
The figure shows the main Apache Hive features
Apache Hive Features

Another advantage of Hive is that the tables are similar to the tables in a relational database. Data is queried using HiveQL. A declarative SQL-like language.
HiveQL allows multiple users to query data simultaneously. Hive supports a variety of data formats and provides a lightweight but powerful translation feature.
For data analysis, custom MapReduce processes can be written and run on clusters in parallel for high performance.

Apache Hive Architecture

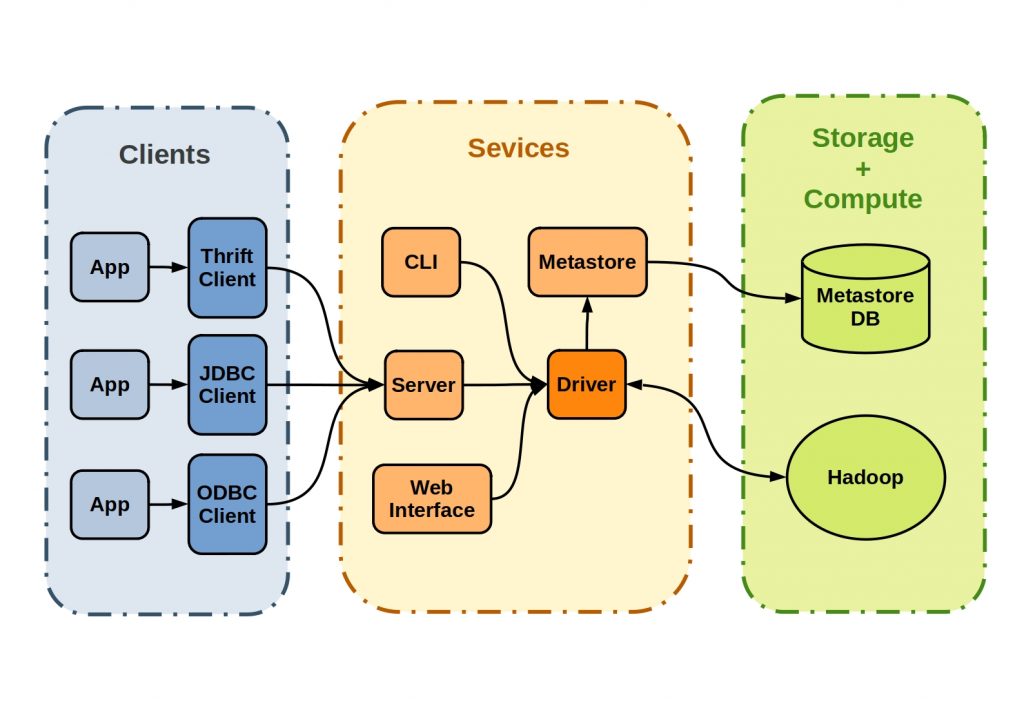
Basically, the architecture of Hive can be divided into three core areas. Hive communicates with other applications via the client area. The integration is then executed via the service area. In the last layer, Hive stores the metadata, for example, or computes the data via Hadoop.

The figure shows the basic three-part core architecture of Apache Hive.
Apache Hive Architecture

Hive Clients

Apache Hive can be accessed via different clients. In addition to Open Database Connectivity (ODBC), an SQL-based application programming interface (API) created by Microsoft, there is Java Database Connectivity (JDBC), an SQL-based API developed by Sun Microsystems to allow Java applications to use SQL for database access. Hive also provides a high-performance Apache Thrift connection.

Hive Services

The core and central control of the Hive Services is the so-called driver. This
receives HiveQL commands and is responsible for their execution against the Hadoop system. It typically consists of a compiler that translates HiveQL requests into abstract syntax and executable tasks, an optimizer that aggregates, splits, and optimizes for better performance and scalability, and an executor that interacts with Hadoop’s job tracker and passes tasks to the system for execution.

Apache Hive also provides the ability to submit these tasks directly to the driver. Using the Command Line and User Interface (CLI + UI), it is possible to directly influence the process.

Metadata about persistent relational entities, i.e. databases, tables, columns and partitions are managed by the metastore.

Hive Storage and Computer

The metadata is stored here in a persistence. The results of the query and the data loaded into the tables are stored on HDFS in the Hadoop cluster.

PCA vs Linear Regression – Therefore you should know the differences

PCA vs Linear Regression – Two statistical methods that run very similarly. However, they differ in one important respect. What the two methods actually are and what this difference is, we explain to you in the following article.

What is a PCA?

Principal Component Analysis (PCA) is a multivariate statistical method for structuring or simplifying a large data set. The main goal here is the discovery of relationships in 2 or 3 dimensional domain.
This method enjoys great popularity in almost all scientific disciplines and is mostly used when variables are highly correlated.


However, PCA is only a reliable method if the data are at least interval scaled and approximately normally distributed.
Although the variables are adjusted to avoid redundant effects, the error and residual variance of the data are not taken into account.
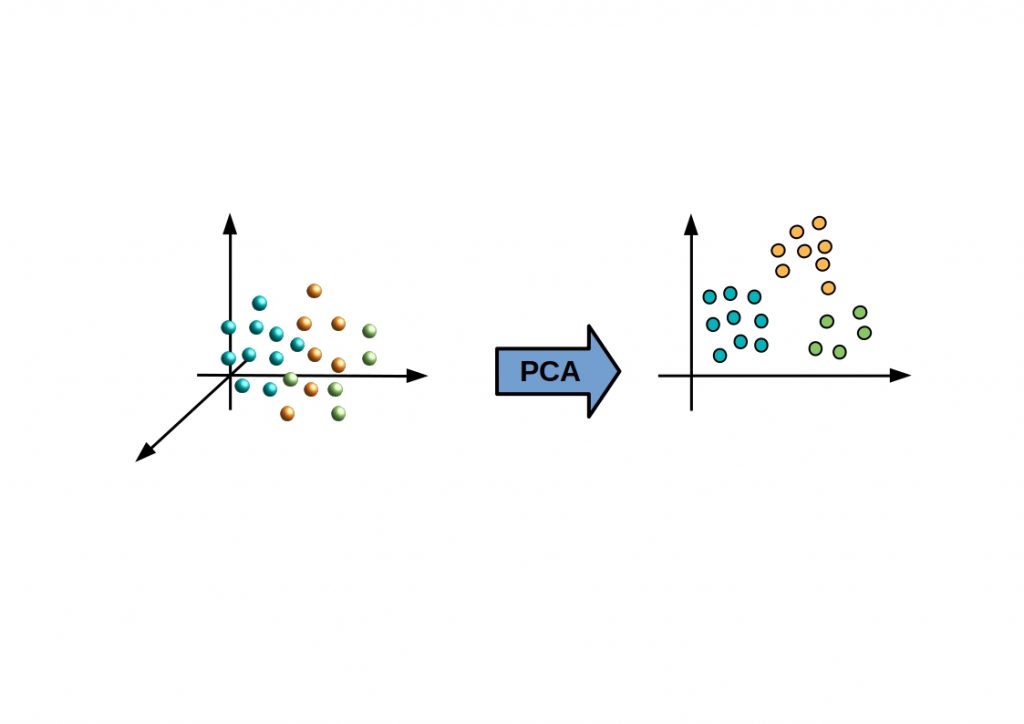
The following figure shows the basic principle of a PCA. High dimensional data relationships should be represented in a low dimensional way, with as little loss of information as possible.
PCA vs Linear Regression - Figure shows the basic principle of a PCA. High dimensional data relationships should be represented in a low dimensional way, with as little loss of information as possible.
PCA vs Linear Regression – Basic principle of a PCA

The key point of PCA is dimensional reduction. It is to extract the most important features of a data set by reducing the total number of measured variables with a large proportion of the variance of all variables.
This reduction is done mathematically using linear combinations.

What are linear combinations?

PCA works in a purely exploratory way, searching the data for a linear pattern that best describes the data set.
These linear combinations can best be thought of as straight lines between variable values.
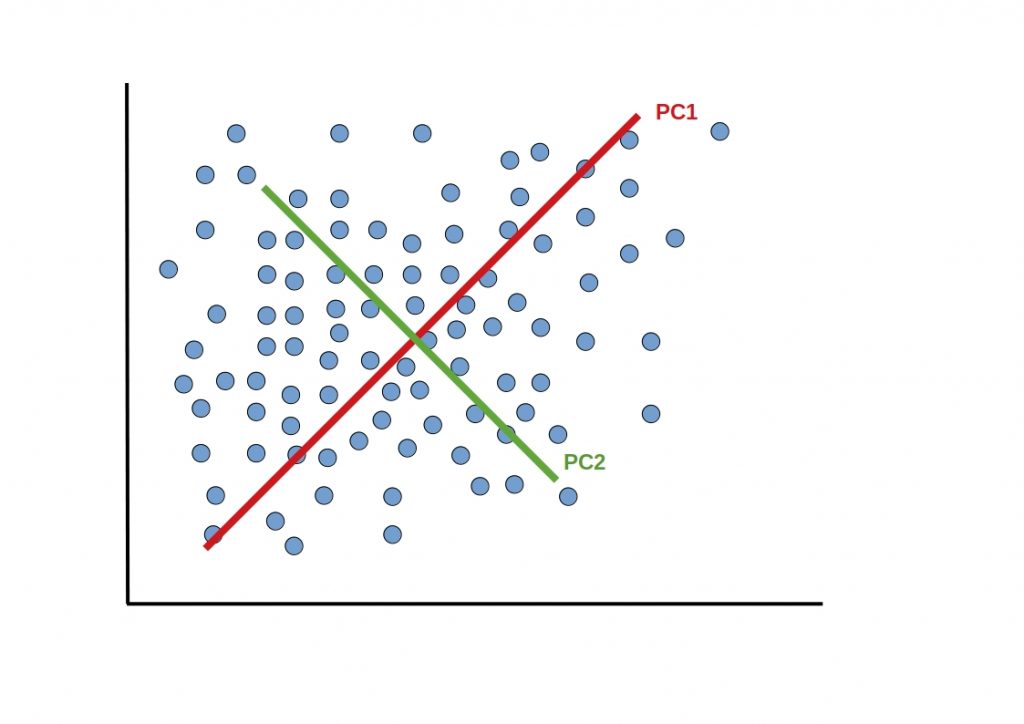
In the figure below, the linear combinations have been applied to a data set.

PCA vs Linear Regression -In this scheme the linear combinations have been applied to a data set
Linear combinations

How does the algorithm work?

In the principal component analysis procedure, a set of fully uncorrelated principal components are first generated.
These contain the main changes in the data and are also known as latent variables, factors or eigenvectors.
The number of extracted components is given here by the data.

The first principal component is formed by minimizing the sum of squared variances of all variables.
During extraction, the variance component is maximized over all variables.
Then, the remaining variance is gradually resolved by the second component until the total variance of all data is explained by the principal components.

The first factor always points in the direction of the maximum variance in the data.
The second factor must be perpendicular to it and explain the next largest variance

PCA vs Linear Regression – How do they Differ?

We have studied the PCA and how it works in great detail. But what are the differences to linear regression?

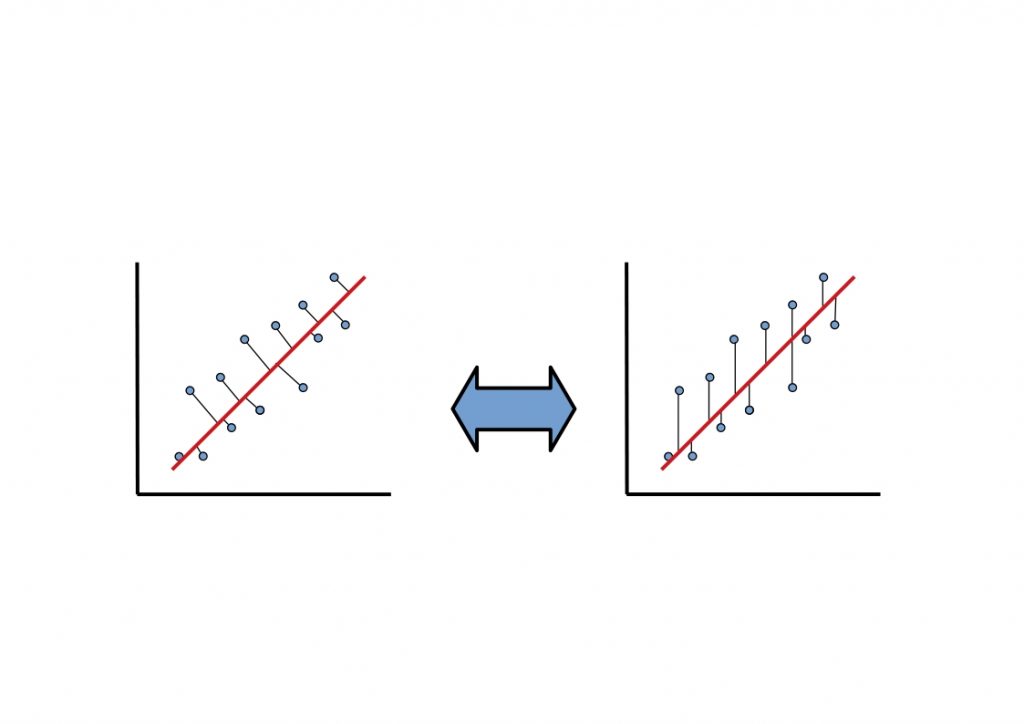
In the following illustration the main difference is set up against each other.

PCA vs Linear Regression -  The figure shows the main difference between the two methods. The minimization of the error squares to the straight line.
PCA vs Linear Regression – Minimization of the Error Squares to the Straight Line

With PCA, the error squares are minimized perpendicular to the straight line, so it is an orthogonal regression. In linear regression, the error squares are minimized in the y-direction.

Thus, linear regression is more about finding a straight line that best fits the data, depending on the internal data relationships.
Principal component analysis uses an orthogonal transformation to form the principal components, or linear combinations of the variables.

So this difference between the two techniques only becomes apparent when the data are not completely independent, but there is a correlation.

If you want to know more about machine learning methods and how they work, check out our article on the t-SNE algorithm.

When to choose NoSQL over SQL?

When to use NoSQL vs SQL – In this article we explain the important differences.
With the right choice of storage medium, you can build elementary more performant architectures in times of Big Data. Streaming platforms can now process huge streams of data in real time. But this technology is not a panacea. The database, for example, still occupies an important place in today’s data handling.
Often, however, it is crucial that you choose the right system for your data and in relation to the overall infrastructure.

when to use NoSQL vs SQL – Spoiled for choice

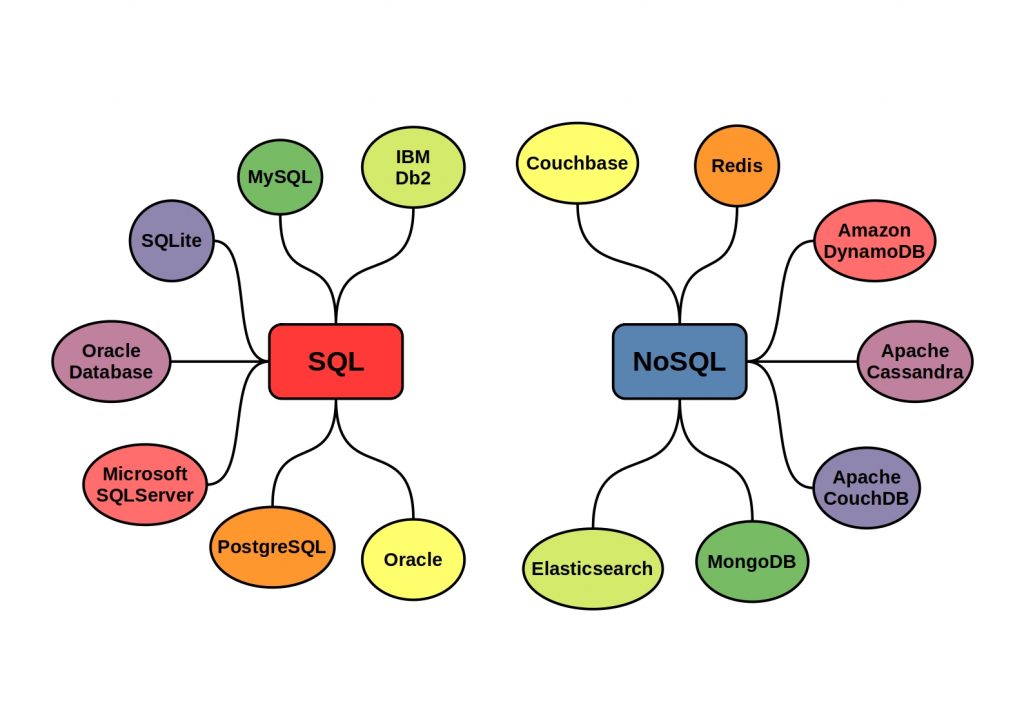
Database vendors abound. Here is just a small selection of popular databases.

popular examples nosql sql
Popular SQL and NoSQL Databases

But before you get into the differences between the databases, you should basically know the differences between the systems.

SQL is relational

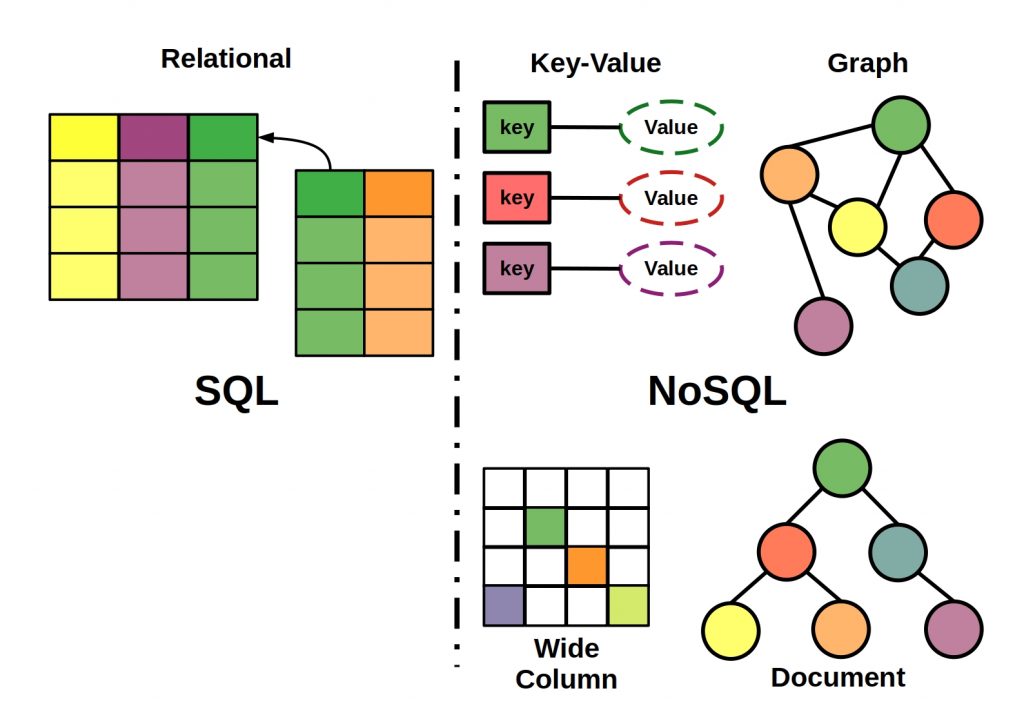
Structured Query Language (SQL) databases consist of a fixed defined schema structure. All schemas contain tables with columns. Each table row (tuple) represents a data set (record). In addition, each row consists of a set of attributes (characteristics).

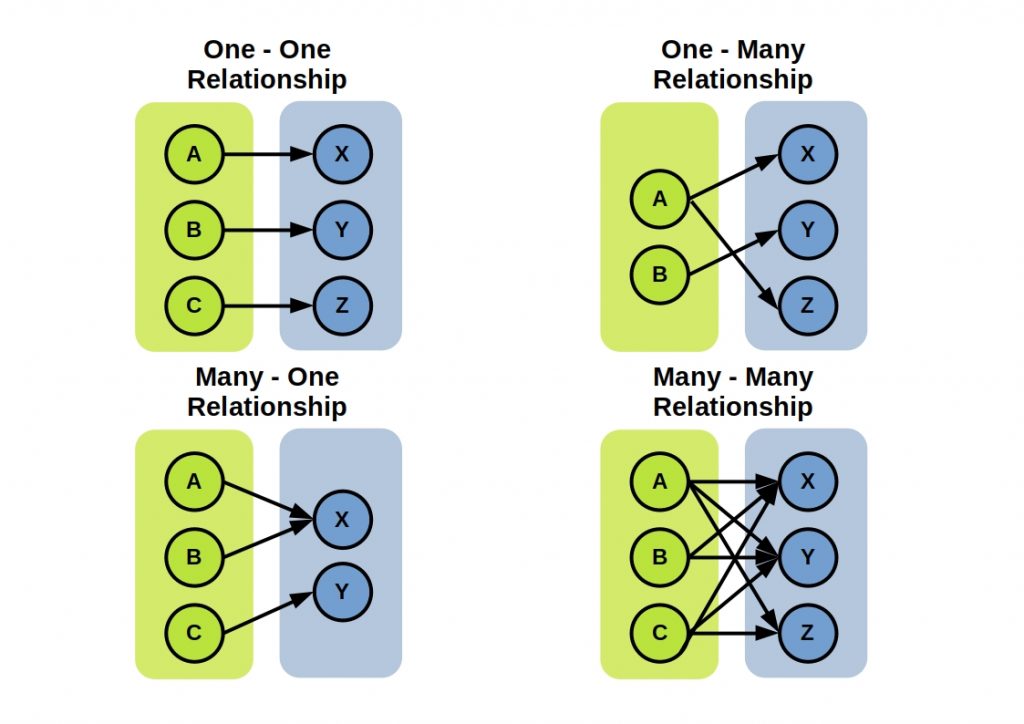
You can use the query language to manipulate and retrieve tables. You can also control the relationships between these structured data formats. Each table in a database can be linked to each other.
These relationships can take many forms. Table cells can have single relationships, or relationships with many cells.

This schema clearly shows all SQL table cells elationships
SQL table cells relationships

NoSQL is not relational

Not only SQL (NoSQL) databases allow you to store and retrieve unstructured data using a dynamic schema. For example, your data is stored in the form of n collections, each containing m documents. Other forms are key-value stores, or graph databases. Thus, there is no special query language here

when to use NoSQL vs SQL – Both in direct comparison.


NoSQL databases exist since 1998 and is relatively young compared to SQL. SQL was already developed in the 70s. Besides the actual structure, databases of both categories differ in that they are scalable in different ways. In contrast to
NoSQL databases, SQL databases can only be scaled vertically.
Furthermore, it is important for you to know that you cannot write to and read from an SQL database in parallel. In NoSQL databases, you can read what data is available at that moment.

when to use NoSQL vs SQL - This picture shows schematically and clearly the differences between NoSQL and SQL databases
SQL vs NoSQL

When to use NoSQL vs SQL

Which one suits me?


As you might have guessed, the answer here is: it depends! The differences are there and can have an important impact on the performance of your services. So the choice always depends on the application purpose. Especially for BigData use cases you should choose a NoSQL database, because here you don’t have to wait for the transaction to complete. Where you need high flexibility, due to frequently changing data structures, or real-time processing, you should also go for NoSQL DBs. However, if you want acid guarantees, you will have to go for an SQL solution. It is important for you to understand that both systems coexist, complement each other and do not replace each other.

If you want to know how to partition a database, check out this article.

H2O AI – That’s why it’s so great

There is a lot of Big Data software available now. One of them that you should definitely know about is the H2O AI Machine Learning solution.

With this open-source application you can implement algorithms from the fields of statistics, data mining and machine learning. The H2O AI Engine is based on the distributed file system Hadoop and is therefore more performant than other analysis tools. Your machine learning methods can thus be used as
parallelized methods.

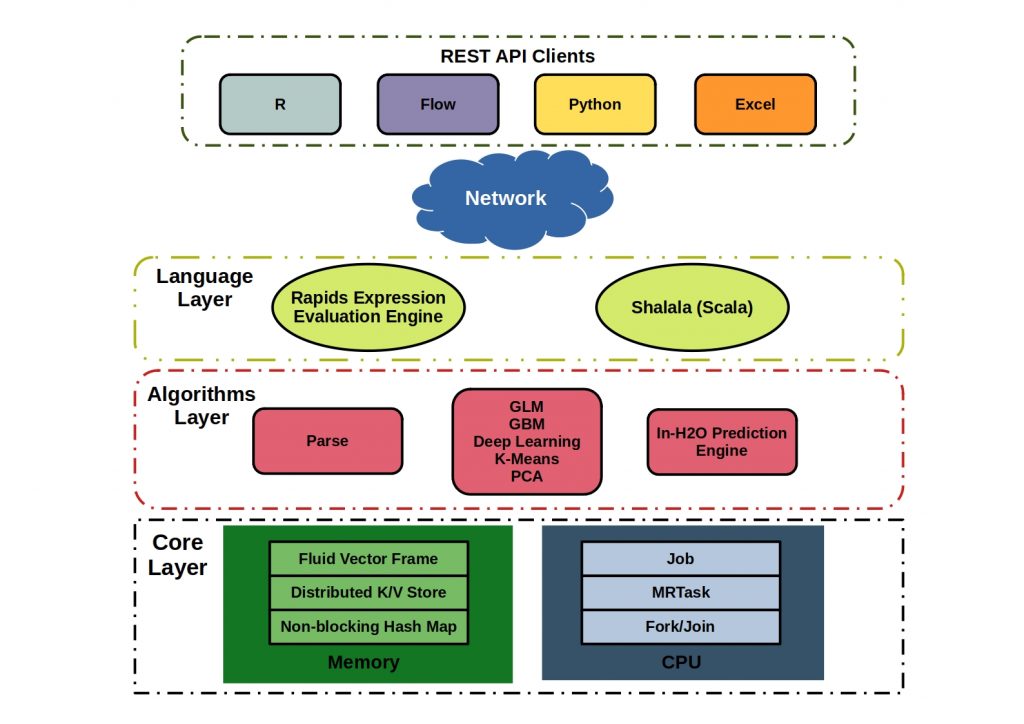
Software Stack

They can program their algorithms in R, Python and Java and thus in the most important mathematical programming languages. H2O provides a REST interface to Python, R, JSON and Excel. Additionally, you can access H2O directly with Hadoop and Apache Spark. This makes integration into your data science workflow much easier. You already get approximate results while running the algorithms. A graphical web browser UI helps you to better analyze the processes and perform targeted optimizations.

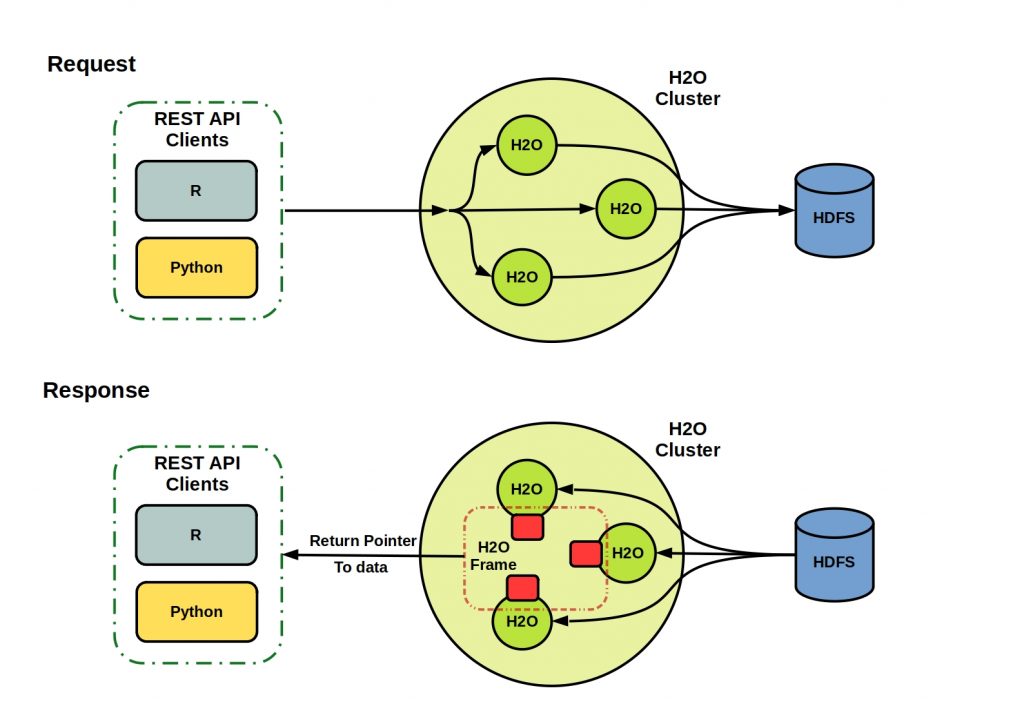
How Clients Interacts with H2O AI

You can interact with H2O via clients using various interfaces. It is important for you to know that the data is usually not held in memory. They are localized in a H2O cluster and you only get a pointer to the data when you make a request.

How Clients Interacts with H2O AI
H2O Interaction flow

H2O Frame

The basic unit of data storage accessible to you is the H2O Frame. This corresponds to a two-dimensional, resizable and potentially heterogeneous data point. This tabular data structure also contains labeled axes.

H2O Cluster

Your H2O cluster consists of one or more nodes. A node corresponds to a JVM process and this process consists of three layers.

H2O Machine Learning Software Structure
H2O Software Stack

H2O Machine Learning Components

Language Layer

The R evaluation layer is a slave to the REST client front-end and in the Scala layer you can write native programs and algorithms. You can then use these with H2O Machine learning.

Algorithms Layer

This layer is where your algorithms are applied. You can run statistical methods, data import and machine learning here.

Core Layer

In this layer you handle the resource management. You can manage both the memory and the CPU processing capacity.

Array vs Object – The creation of a JSON structure follows some rules you should know

Array vs Object – JSON is one of the most popular data formats. However, the creation of such an object is done according to some rules. These rules depend on the original data type. In this article we will introduce you to the conversion of some JSON data types (Array vs Object).

What is JSON anyway?

With the JavaScript Object Notation, JSON for short, you can structure data compactly and independently of programming languages. The data format is therefore particularly well suited for exchange between your applications, for general data storage (file extension “.json”) and for configuration files. The data is also readable for you and coded in the standardized text format. The application notes of the data format are defined by the standards – RFC 8259 and the JSON syntax by the standards ECMA-404. Due to its easy integration with JavaScript, you can use it well for transferring data in web applications.

You can best compare the JSON data structure to XML and YAML, only it’s simpler and more compact.

What are the basic rules?

This code snippet shows a simple json object structure
Simple JSON Object

The JSON text structure is based on the JavaScript Object Syntax. Hierarchical data structures are thus possible. It contains only properties and no methods. The basis is formed by name-value pairs and ordered list of values. Basically, they are formatted with curly braces and as strings. This is especially advantageous if you want to transfer the data over the network. If you want to access the data you have to convert the text structure into a native JavaScript object.

Data Formats – JSON Array vs Object

Basically, you can have different data types included in JSON.

Value:

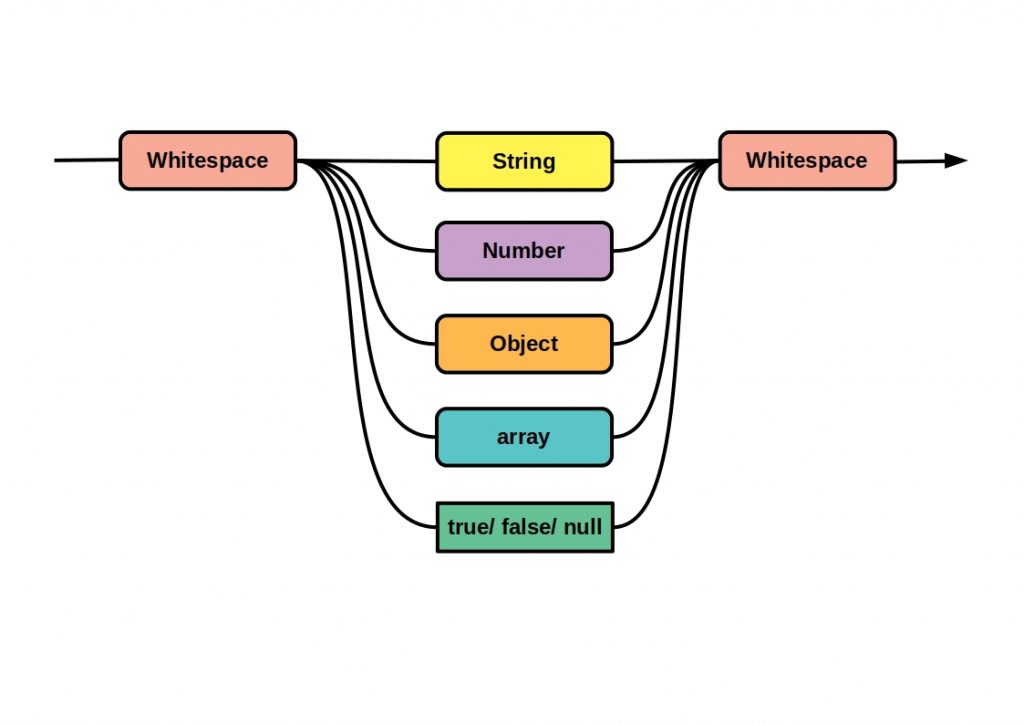
Your JSON value can take one of the following allowed types.

Schematic representation of the data types that a JSON value can assume
JSON value data types

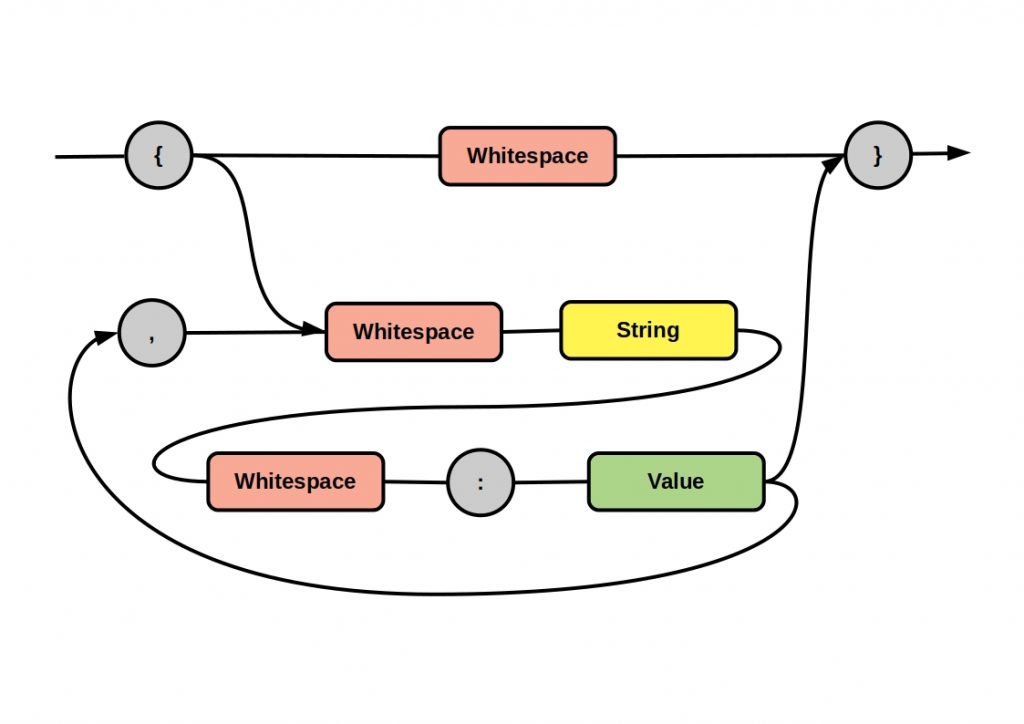
Object:

A JSON object represents the basic form of a JSON text. With this you can accept any data type that is suitable for inclusion in JSON.

JSON Array vs Object - Schematic representation of the creation of a JSON object
Creation of a JSON object

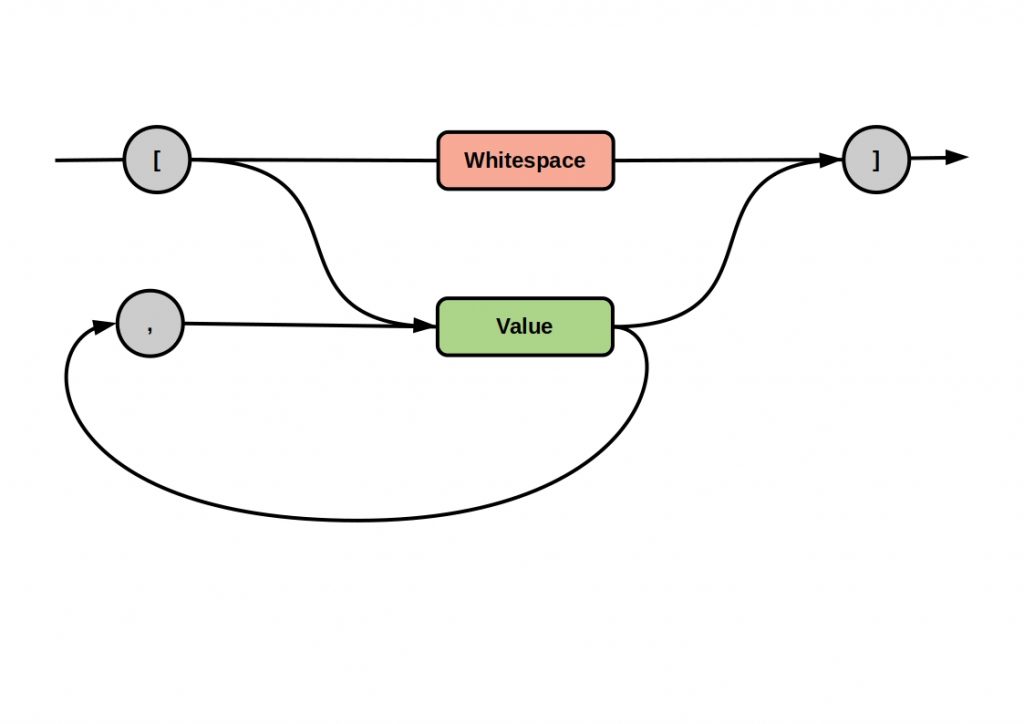
Array:

JSON Array vs Object – It is possible to include an array. Arrays can contain objects, strings, numbers, arrays and boolean. You can include arrays as shown schematically below, enclosed with two square brackets.

JSON Array vs Object - Schematic representation of the creation of a JSON array
Creation of a JSON array

In this way, you can further and further nest the individual data types with each other and thus easily create any number of hierarchy levels. For example, object attributes can consist of arrays, or arrays can contain multiple objects.

5 Clustering Algorithms Data Scientists need to know – The key is always to understand the basic approach of any algorithm you want to use

As a data scientist, you have several basic tools at your disposal, which you can also apply in combination to a data set. Here we present some clustering algorithms that you should definitely know and use

In times of Big Data, not only the sheer number of data increases, but also the relationships between them. More and more complex dependencies are formed. This makes it all the more difficult to recognize these similar properties and to assign the data to so-called clusters in a way that can be evaluated.

You have certainly heard of these algorithms and maybe used one or the other, but do you really know what clustering algorithms are?

What are clustering algorithms?

So let’s first clarify what these algorithms are in the first place. The goal is clear: You want to identify similar properties between individual data points in a data set and group them in a meaningful way. These properties are often high-dimensional.

With the help of cluster analysis, you want to reduce this high-dimensional information to a low-dimensional dependency. So, for example, a representation in 2D space. Clustering is an unsupervised machine learning technique and in the end you classify the data points by using algorithms.

The approach to clustering differs from technique to technique. All have their advantages and disadvantages, so it makes sense to try several on one set of data, or apply them in combination. Below we will introduce you to some popular clustering methods and explain their grouping approach.

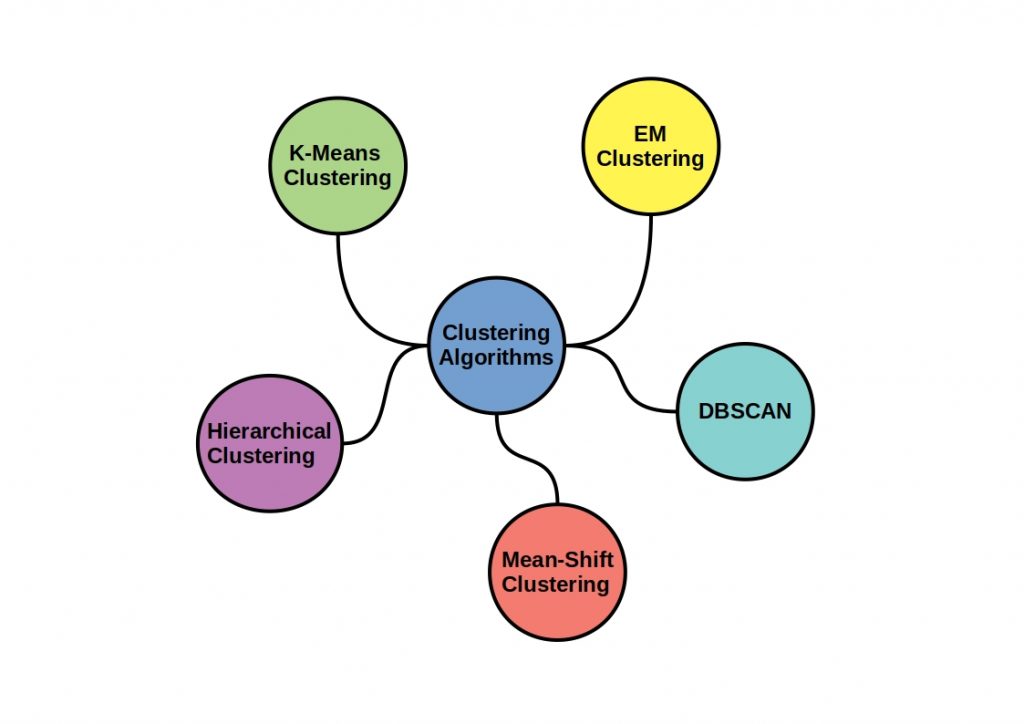
This picture shows schematically popular Clustering Machine Learning Algorithms you should know as a data scientist
Clustering Machine Learning Algorithms – Popular clustering algorithms

Mean-Shift Clustering

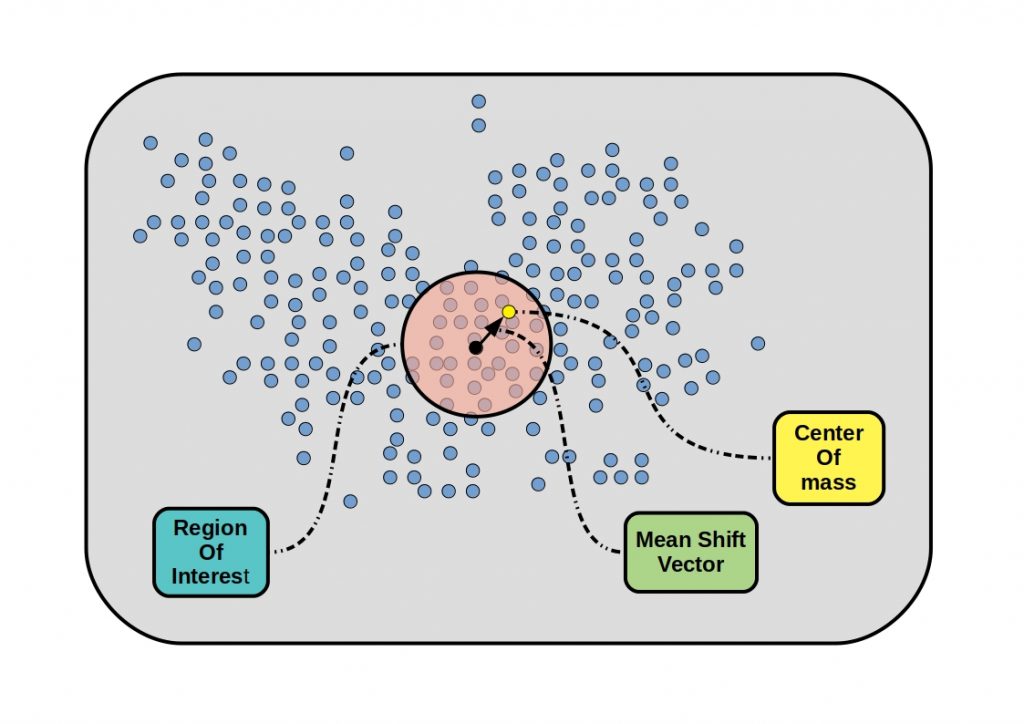
The first algorithm we want to introduce you to is Mean-Shift Clustering. With this you can find dense areas of data points according to the concept of kernel density estimation (KDE). The basis of the clustering is a circular sliding window, which moves towards higher density at each iteration. Within the window, the centers of each class are determined, called centroids.

The movement is now created by moving the center to the average of the points within the window. The density within the sliding window is thus proportional to the number of points within it. This motion continues until there is no direction in which the motion can take more points within the kernel.

Clustering Machine Learning Algorithms - Schematic and simplified representation of the Mean-Shift principle.
Clustering Machine Learning Algorithms – Mean-Shift Clustering Priciple

Hierarchical Cluster Analysis (HCA)

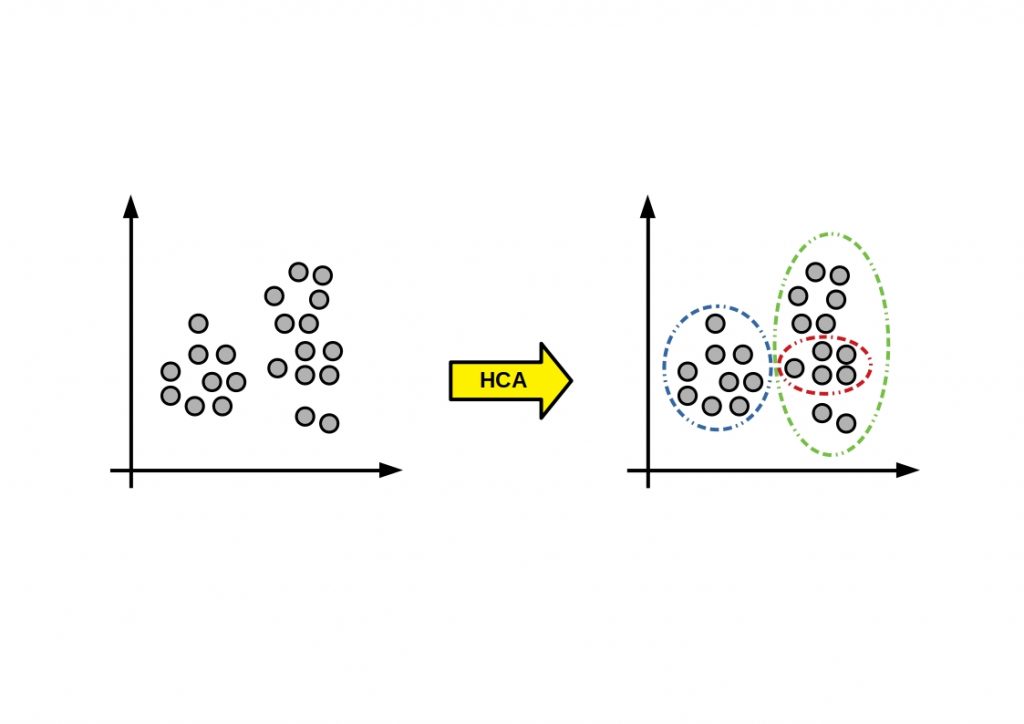
With HCA, clusters are formed based on empirical similarity measures of the data points. This means that the two most similar objects are assigned one after the other until all objects are in one cluster. This results in a tree-like structure. In contrast to the K-means algorithm, which we will discuss later, similarities between the clusters play a role. These are represented by a cluster distance. With K-means, only all objects within a collection are similar to each other, while they are dissimilar to objects in other clusters.

You can create an HCA in different ways. There are two elementary procedures, the top-down and the bottom-up. If you want to know more about Hierarchical Cluster Analysis, read this article.

Schematic and simplified representation of the HCA clustering  principle.
Clustering Machine Learning Algorithms – HCA Principle

Expectation-Maximization (EM) Clustering using Gaussian Mixture Models (GMM)

GMM basically assumes that the data points are Gaussian and not circular. The clusters are described by their mean and standard deviation. Each Gaussian distribution is randomly assigned to a single cluster and found using the Expectation-Maximization (EM) optimization algorithm. The probability of belonging to a cluster is then calculated for each data point. Thus, the closer a point is to the Gaussian center, the more likely it is then to belong to that cluster. Based on these probabilities, a new set of parameters for the Gaussian distributions is iteratively calculated. That is, the probabilities within a cluster are maximized.

K-Means clustering algorithms

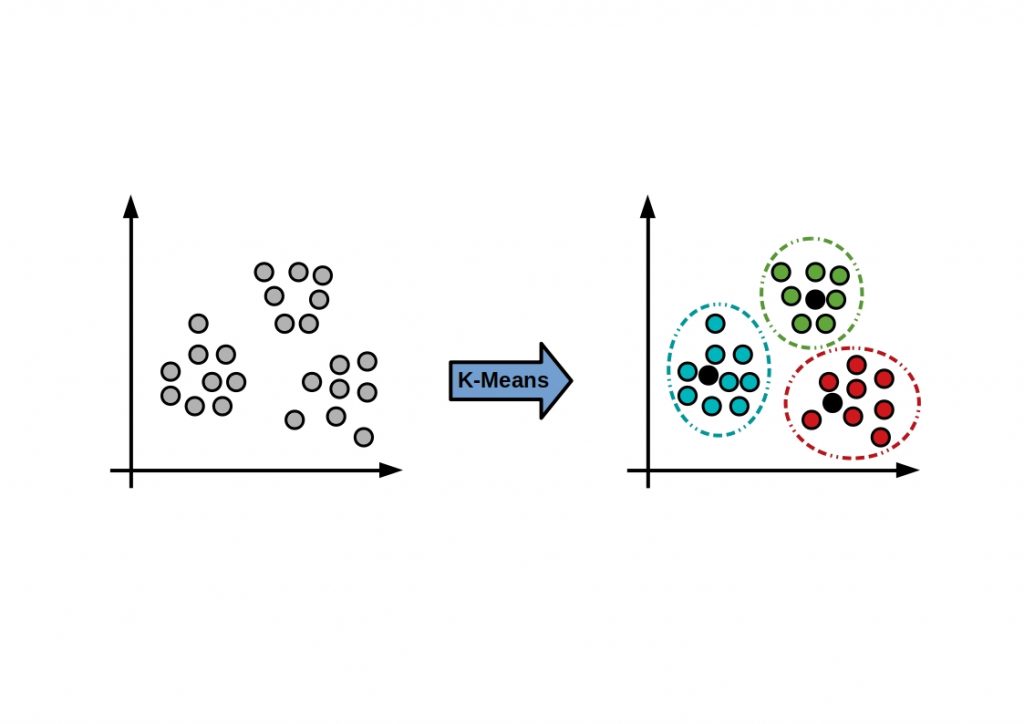
The k-Means algorithm described by MacQueen, 1967 goes back to the methods described by Lloyd, 1957 and Forgy, 1965. You can use the algorithm besides cluster analysis also for vector quantization. Here, a data set is partitioned into k groups with equal variance.

The number of clusters must be specified in advance. Each disjoint cluster is described by the average of all contained samples. The so-called cluster centroid.


Each centroid is updated to represent the average of its constituent instances. This is done until the assignment of instances to the clusters does not
changes any more. If you want to learn more about the K-means algorithm, check this out.

Schematic and simplified representation.of the kmeans clustering algorithm
K-Means Principle

Density-Based Spatial Clustering of Applications with Noise (DBSCAN)

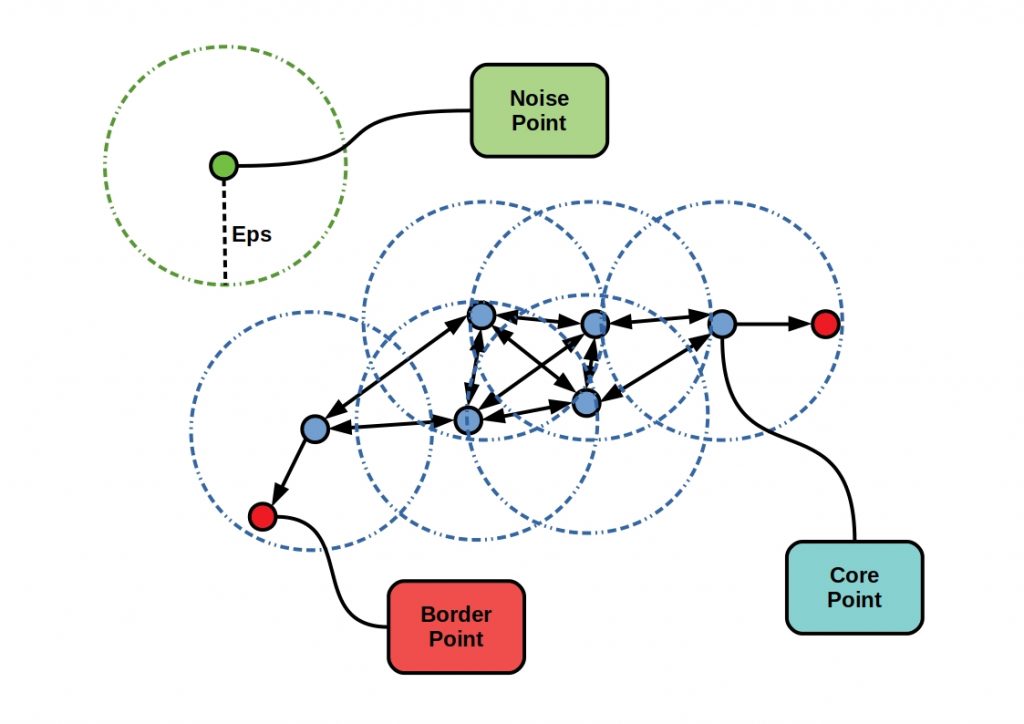
DBSCAN is a density-based cluster analysis with noise. From an arbitrary starting data point, neighborhood points are specified at a distance epsilon. Clustering then begins from a certain neighborhood data point count.

The current data point becomes the first point of the new cluster, or referred to as noise. In both cases, however, it is considered to be examined. The neighboring data points are then added to the cluster. Once all neighbors have been added, a new, unexamined point is called and processed. A new cluster is thus formed.

Schematic and simplified representation of the DBSCAN Clustering principle.
Clustering Machine Learning Algorithms – How DBSCAN works

The field of cluster algorithms is wide and everyone’s approach is different. You should be aware that there is no one solution. You have to consider each algorithm as another tool. Not every technique works equally well in every situation.

The key here is to always understand the basic approach of each algorithm you want to use. Build a small portfolio and get to know these techniques well. Once you master them, you should then add new ones. Knowing your own tools is crucial to avoid try and error and to gain control over your data. Remember: no result is a result. Your added value here is that even if an algorithm doesn’t work well on your data set, it will give you information about the data properties.

« Older posts