EXPERT KNOWLEDGE AT A GLANCE

Tag: matplotlib

NumPy vs Pandas – Which is used When?

NumPy vs Pandas – Since in our time in every science and economic branch ever larger amounts of data accumulate, which must be analyzed and managed performantly, the learning of a programming language has become interdisciplinary indispensable.

For many, Python is the first programming language in the classical sense, due to its beginner friendliness and mathematical focus. Python offers the possibility of accessing ready-made, optimized computational tools through the modular implementation of powerful mathematical libraries.
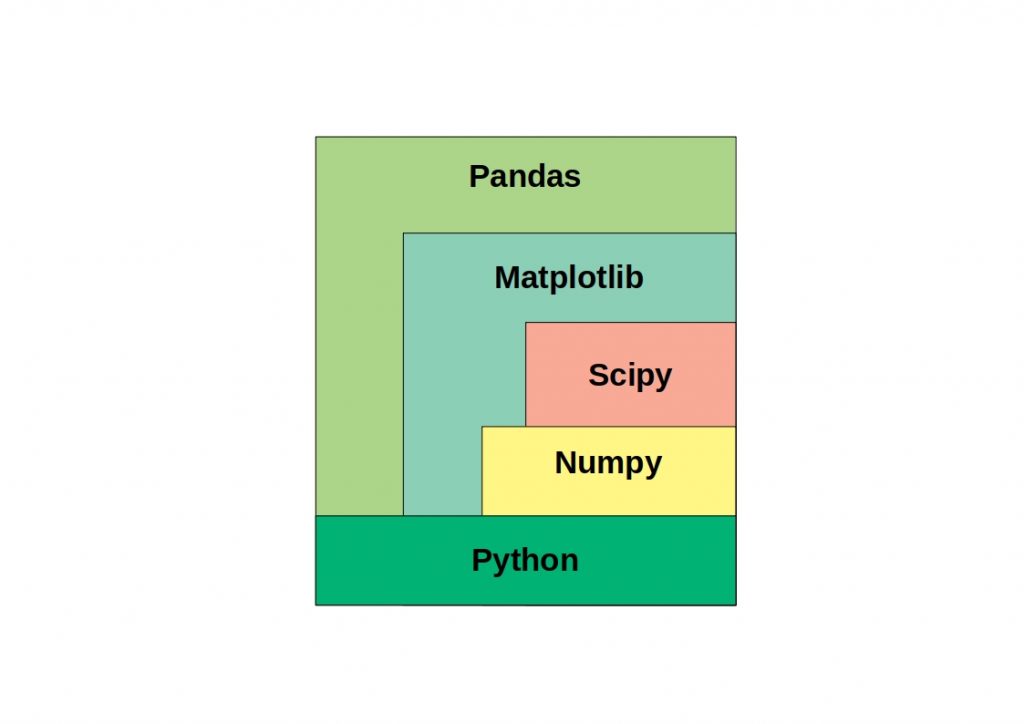
NumPy vs Pandas - The schme shows popular python libraries and their place in the Python ecosystem
NumPy vs Pandas – Their place in the Python ecosystem

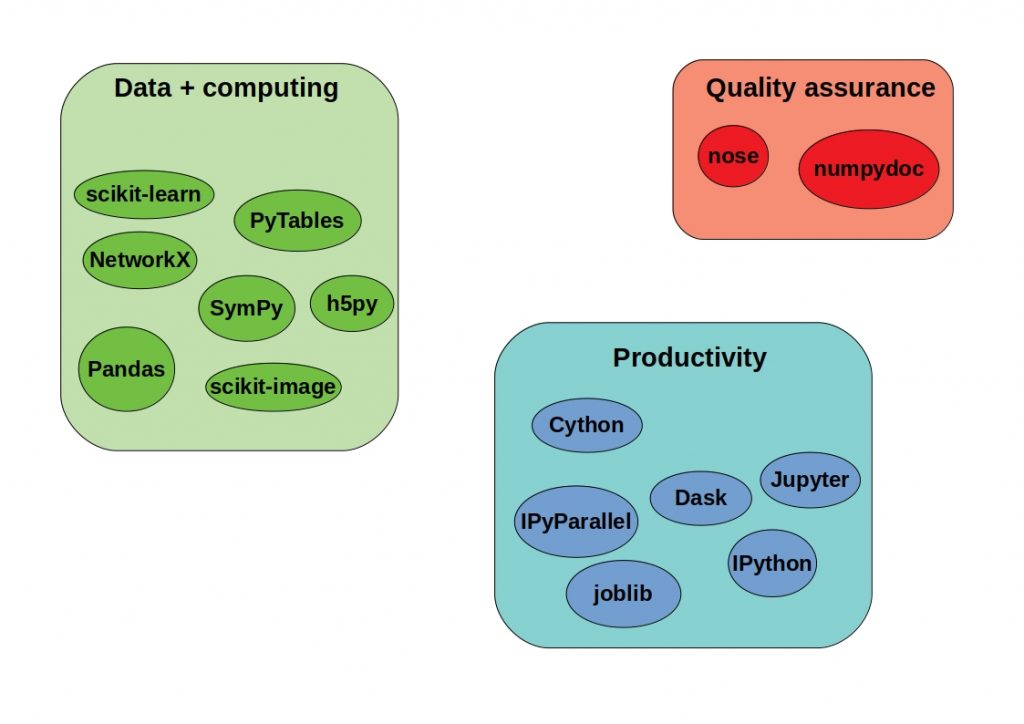
However, this offer can also quickly become overwhelming. Which library, which framework is suitable for my purposes? Will I save myself work with this tool, or will I reach its limits? Here you can learn more about SciPy and why you should definitely prefer it over MATLAB and here we compared the two Python visualization methods matplotlib and seaborn. These Python libraries are absolutely compatible with each other and together they make a very interesting data science tool. NumPy and Pandas are perhaps two of the best-known python libraries. But what are the differences between them? We will get to the bottom of this question in this article.

What actually is NumPy?

NumPy stands for “Numerical Python” and is an open source Python library for array-based calculations. It was first released in 1995 as Numeric, making it the first implementation of a Python matrix package, and rereleased as NumPy in 2006. This library is intended to allow easy handling of vectors, matrices, or large multidimensional arrays in general.
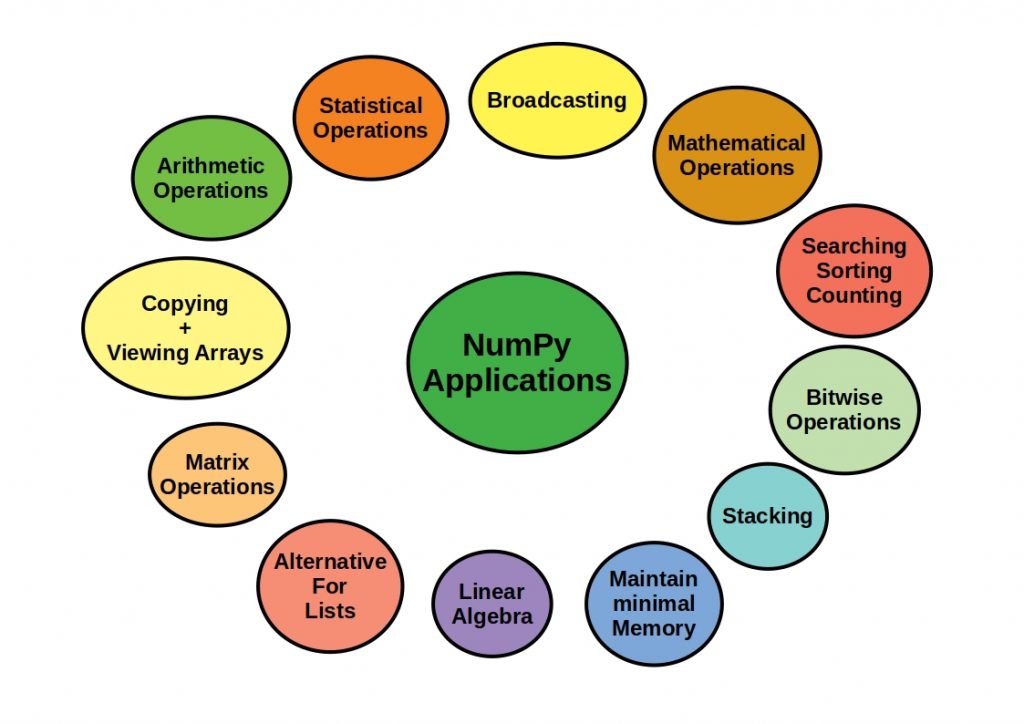
 

The scheme shows NumPys major applications
NumPy vs Pandas – Numpys Major Applications

For performance purposes, it is written in C, a deep, machine-oriented programming language. NumPy is compatible with a wide variety of Python libraries, some of which are also based on NumPy, adding further useful functions to its power, such as: Minimization, Regression, Fourier Transform

Python and Science

As mentioned earlier, Python is the programming language most intensively used in the application domain of scientific research across all disciplines for data processing and analysis. What is very interesting here is that the solution approaches are similar across disciplines at the data level. Thus, an exchange of ideas has become indispensable and leads more and more to a fusion of the sciences.

This is only mentioned in passing, but should also emphasize the importance of this programming language and its libraries, which are so often open source and further developed by a community.

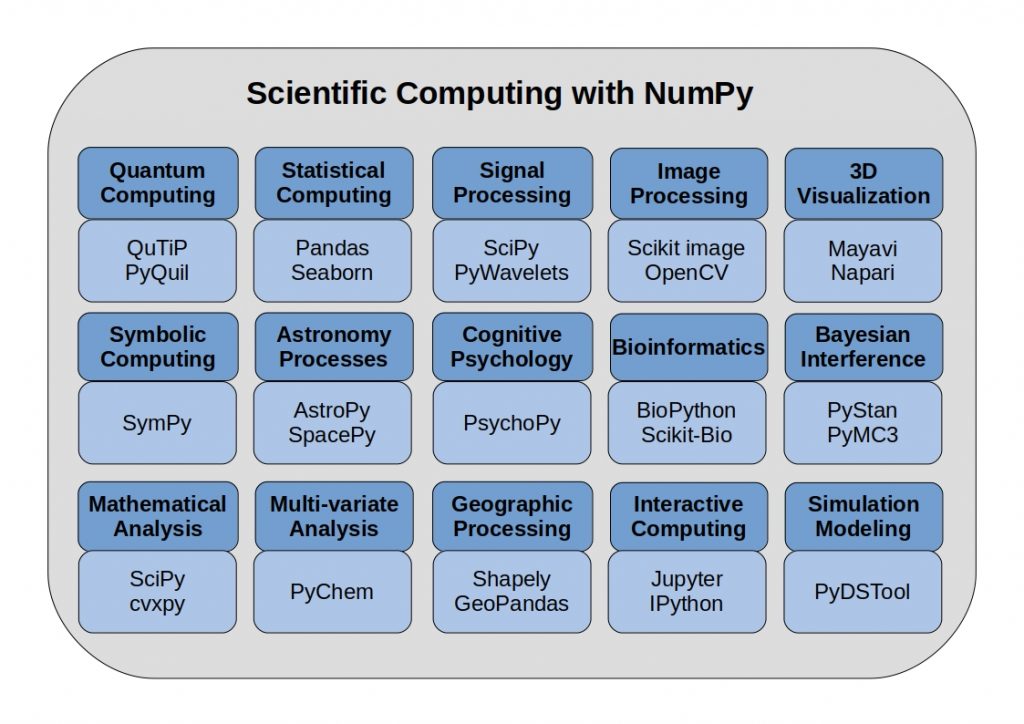
NumPy vs Pandas - The schema shows Scientific Computing with NumPy over science disciplines
NumPy vs Pandas – Scientific Computing with NumPy

NumPy was developed specifically for scientific calculations and forms the basis for many specific frameworks and libraries.

The elementary NumPy data structure

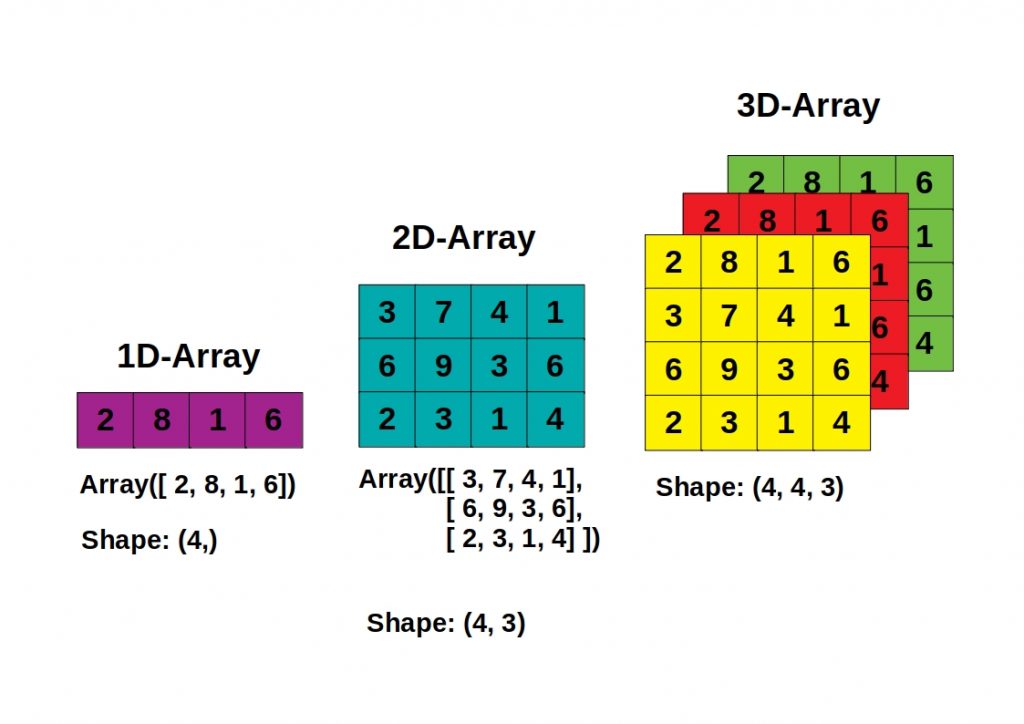
The core functionality of NumPy is based on the “ndarray” data structure.

The schema shows NumPys fundamental data structure
NumPy vs Pandas – NumPys fundamental data structure

Such an array can only hold elements of the same data type and always consists of a pointer to a contiguous memory area together with the metadata describing the data stored in it. This allows processes to access them very efficiently and manipulate them as desired.

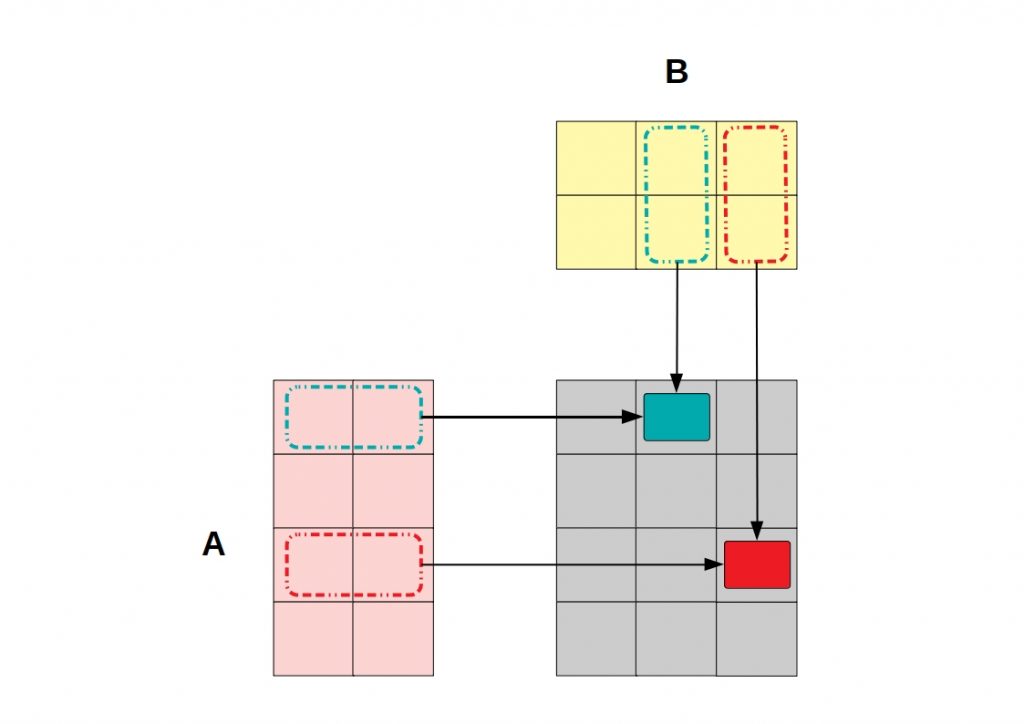
The schema shows how NumPys fundamental data structure could be manipulate
NumPy vs Pandas – NumPys data structure is manipulable

Thus, the shape can be changed via so-called reshaping, smaller subarrays can be created within a given larger array, arrays can be split, or merged.

What is Pandas?

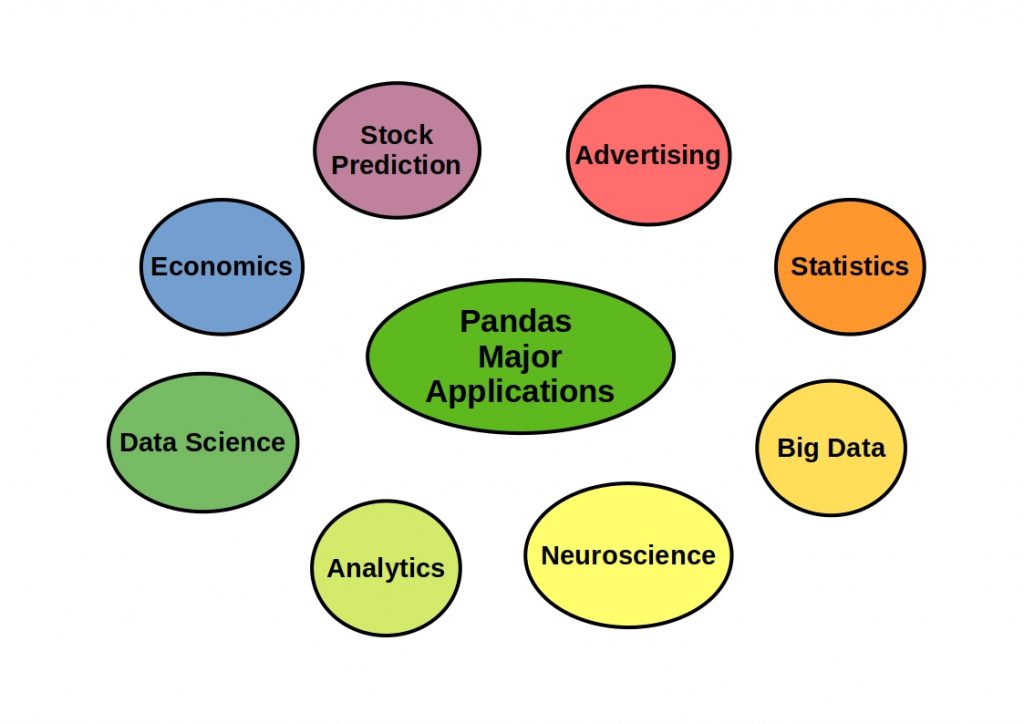
Pandas is an open source library for data analysis and manipulation in Python. Already released in 2008 by Wes McKinney and written in Python, Cython and in C. Pandas are used in almost all areas and find worldwide appeal in all industries.

The schema shows Pandas major applications
NumPy vs Pandas – Pandas Major Applications

The name Pandas is derived from Panel Data.
Its strength lies in the processing and analysis of tabular data and time series.

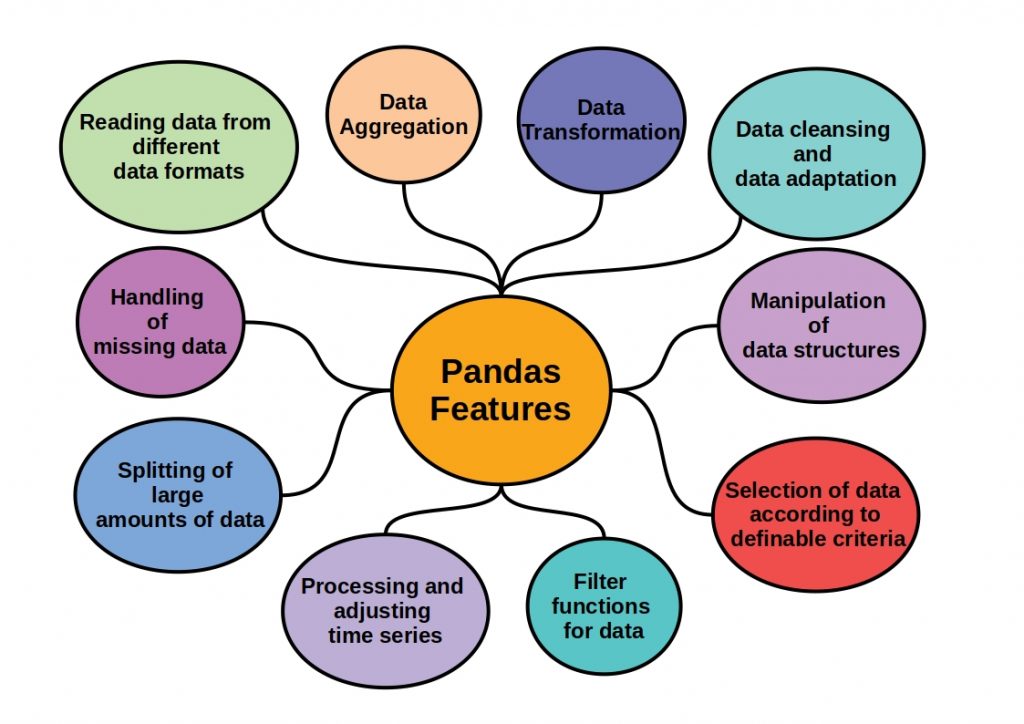
The schema shows Pandas major features
NumPy vs Pandas – Pandas Features

Especially in the pre-processing of data, pandas offers a lot of operations. In addition to high-performance filter functions, very large data volumes with over 500 thousand rows can be transformed, manipulated, aggregated and cleaned.

Pandas fundamental data structures

As a basis for the individual functions and tools that Pandas provides, the library defines its own data objects. These objects can be one, two, or even three-dimensional.

The one-dimensional series object can take up different data types in contrast to NumPys ndarrays and corresponds to a data structure with two arrays. One array as index and one array holding the actual data.

The two-dimensional DataFrame object contains an ordered collection of columns. Here, each column can consist of different data types and each value is unique by a row index and a column index.
The eponymous Panel object is then a three-dimensional dataset consisting of dataframes. These objects can be divided into major axes, which are the index rows of each DataFrame, and minor axes, which are the columns of each of the DataFrames.

NumPy vs Pandas – Conclusion

Both libraries have their similarities, which are due to the fact that Pandas is based on NumPy, but is it an either or question? No, clearly not. Pandas is based on NumPy, but adds so many individual features to its functionality that there is a clear justification for their parallel existence. They simply serve different purposes and should be used for both.


One of the main differences between the two open source libraries is the data structure used. Pandas allows analysis and manipulation on a tabular form while NumPy works mainly with numerical data in arrays whose objects can have up to n dimensions. These data forms are easily convertible among themselves via an interface.

Pandas is more performant especially with very large data sets (500K rows and more). This makes data preprocessing and reading from external data sources easier to perform with Pandas and can then be transferred as a NumPy array into complex machine learning or deep learning algorithms. If you want to know more about machine learning methods and their fields of application, take a look at this article from us.

Matplotlib vs Seaborn – Who owns the Python visualization throne?

Matplotlib vs Seaborn – Matplotlib is often the first choice when it comes to creating mathematical plots with Python. But is it always the best choice? With Seaborn there is a potent competitor.

Matplotlib was developed by John D. Hunter back in 2003 and has become indispensable. Due to the increasing importance of the Python programming language in almost all scientific areas, the importance of fully compatible visualization methods is also growing.


Due to its open source concept, Matplotlib can be used absolutely free of charge and is a basic component of many popular Python distribution platforms, such as Anaconda.


The library offers a MATLAB-like interface and can be used in combination with NumPy, Pandas and Scipy, just like MATLAB.

SciPy is a collection of mathematical algorithms and convenience functions and is mainly used by scientists, analysts and engineers for scientific computing, visualization and related activities.
NumPy allows easy handling of vectors, matrices, or large multidimensional arrays in general.
NumPy’s operators and functions are optimized for multidimensional array operations and evaluate particularly efficiently.

Pandas is also an open source Python library that can be used to perform data analysis and manipulation efficiently. Its strength lies in the processing and evaluation of tabular data and time series.

These components, which are absolutely compatible with each other, offer in their entirety an absolutely free, but fully comprehensive alternative to the commercial analysis software MATLAB.

This figure shows some Python libraries, which together form an open source MATLAB alternative.
Matplotlib vs Seaborn – Together the Python libraries form a MATLAB replacement

Python Matplotlib – What are the features?

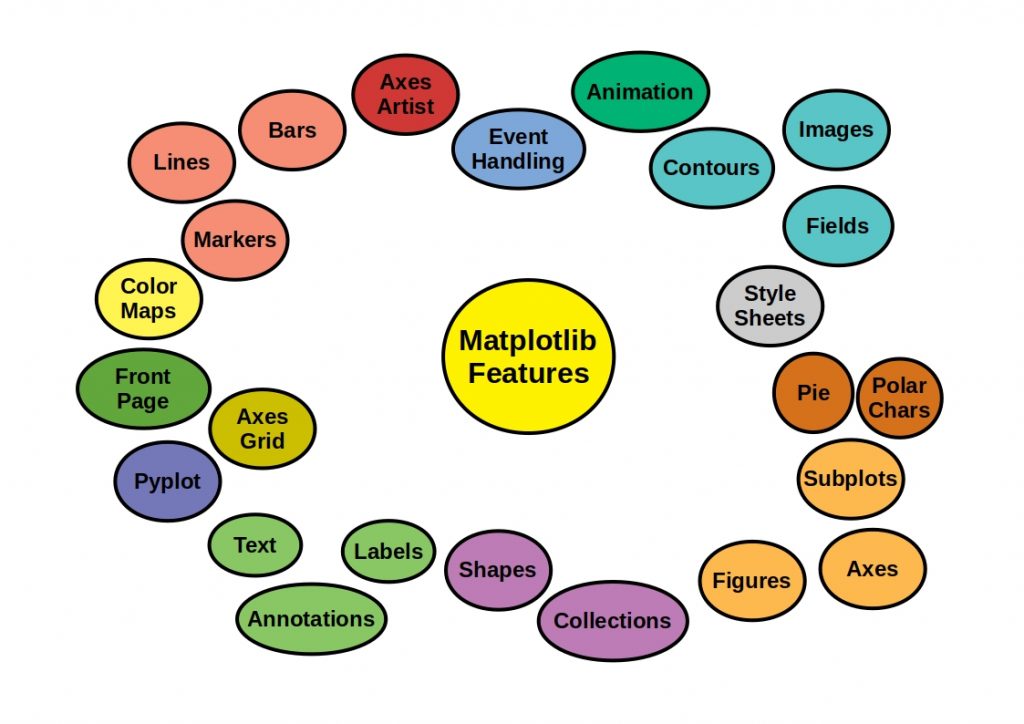
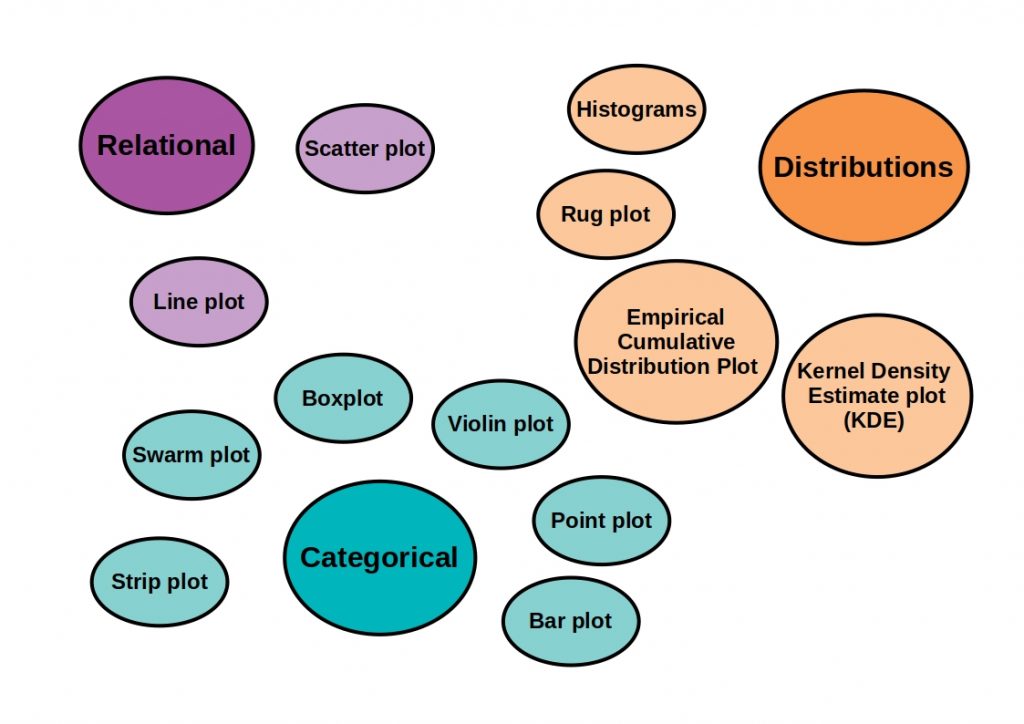
The library offers a wide range of visualization functions. Some of them are listed in the figure below.

Matplotlib vs Seaborn - This figure shows Matplotlib features sorted by their use cases.
Matplotlib vs Seaborn – Matplotlib Features

Matplotlib is designed to effectively visualize the results of mathematical calculations. Visualization is an efficient and important data analysis tool.
The library is able to generate all the usual diagrams and figures by default. It is even possible to create animations that can be used to better understand the flow of certain algorithms.

Event Handling

Matplotlib offers an important feature with event handling. Behind the name is a UI-neutral event model. This allows the library to connect to events without knowing which UI Matplotlib will eventually plug into.


This allows me to develop a very flexible and portable code.
However, the events can then be used to transfer things like the data coordinate.

PyLab vs Pyplot

PyLab is a collection of functions that is installed together with Matplotlib and make the library work like MATLAB.
The module brings a set of NumPy functions and classes into the namespace. This makes them accessible without having to import them.
However, this often led to conflicts between individual Matplotlib functions.
For this reason, the use of PyLab is now no longer recommended.
Pyplot is a module in Matplotlib and provides the state-machine interface to the underlying plotting library.


The conflicts are prevented because an import is done with Pyplot and a separate NumPy import.

Python Matplotlib – Third party packages

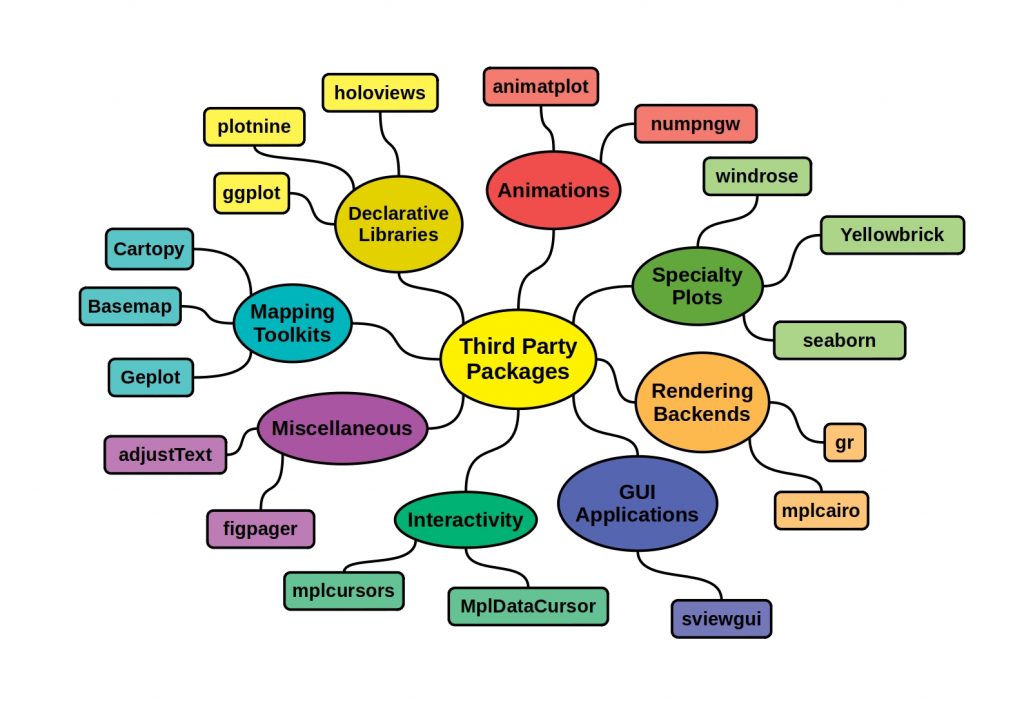
If the standard library features are not enough, you can extend Matplotlib with additional external packages. In the following figure some of the possible extensions are listed and grouped by application.

Python Matplotlib - This figure shows Matplotlib Third Party Packages sorted by their use cases.
Matplotlib vs Seaborn – Matplotlib Third Party Packages

These external packages must be installed individually and extend the functionality of the plotting library, or build on existing features.
They sometimes offer more complex graphics or higher performance data analysis methods. Most of these packages are open source and are constantly updated by very active communities.

Matplotlib also has weaknesses

Matplotlib is not perfect despite the wide feature set. For example, only poor default options for the size and colors of plots are offered. Matplotlib is often considered to be a low-level technology compared to today’s requirements. Thus, very specialized code is needed to generate appealing plots.

What is Seaborn?

Seaborn is a Python visualization library, but based on Matplotlib. This library provides a high-level interface for visualization of statistical data and not only has its own graphics library, but internally uses Matplotlib’s functionalities and data structures.
It thus offers a variety of additional features besides the śtandard Matplotlib functions.

This scheme shows the main features of Seaborn
Matplotlib vs Seaborn – Main features of Seaborn

Among other things, Seaborn provides built-in themes for designing matplotlib graphs and a dataset-oriented API for determining the relationship between variables. It can visualize both univariate and bivariate data and plot statistical time series. Estimation and plotting of linear regression models run automatically and Seaborn, unlike Matplotlib, offers optimization when processing NumPy and Pandas data structures.

So what should you choose?

Especially when it comes to deep statistics, Seaborn clearly has the edge. Matplotlib, however, is often the leaner solution due to its simplicity. So both have their strengths and weaknesses. Which tool you ultimately choose depends on the situation. You can’t do much wrong. With one solution, however, you have more contextual options. But now that you know the differences between the two, this decision will be easier for you.

SciPy turns Python into an ingenious free MATLAB alternative

Python vs MATLAB

== Open source Python library
– a collection of mathematical algorithms and convenience functions

– is mainly used by scientists, analysts and engineers for scientific computing, visualization and related activities

– Initial Realease: 2006; Stable Release: 2020
– depends on the NumPy module
→ basic data structure used by SciPy is a N-dimensional array provided by NumPy

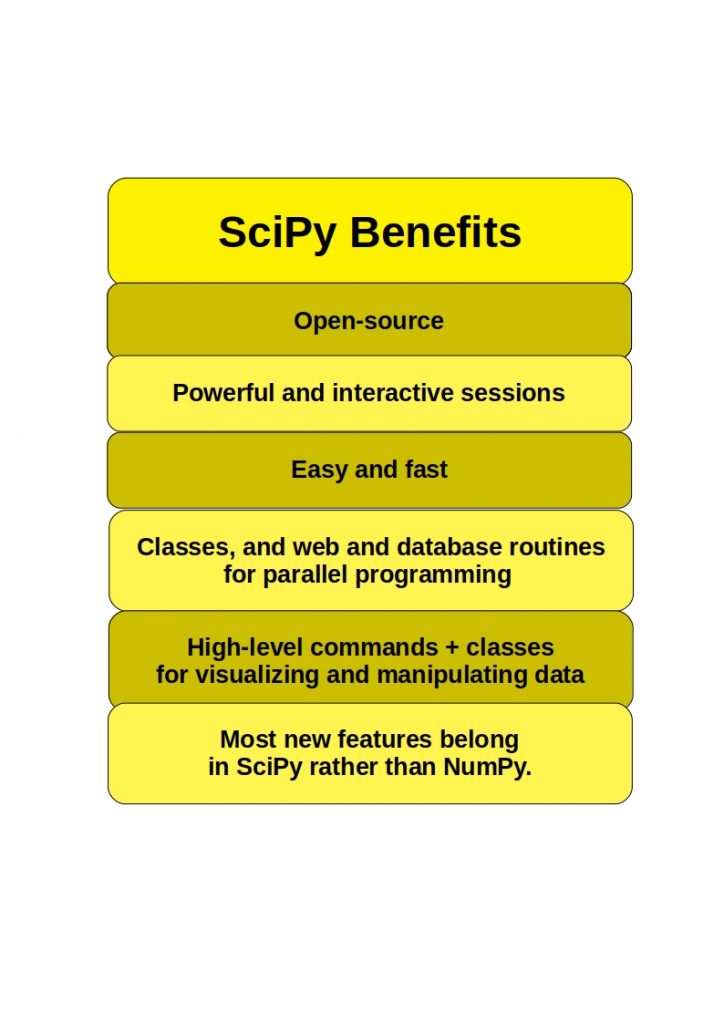
Benefits

scipy benefits

Features

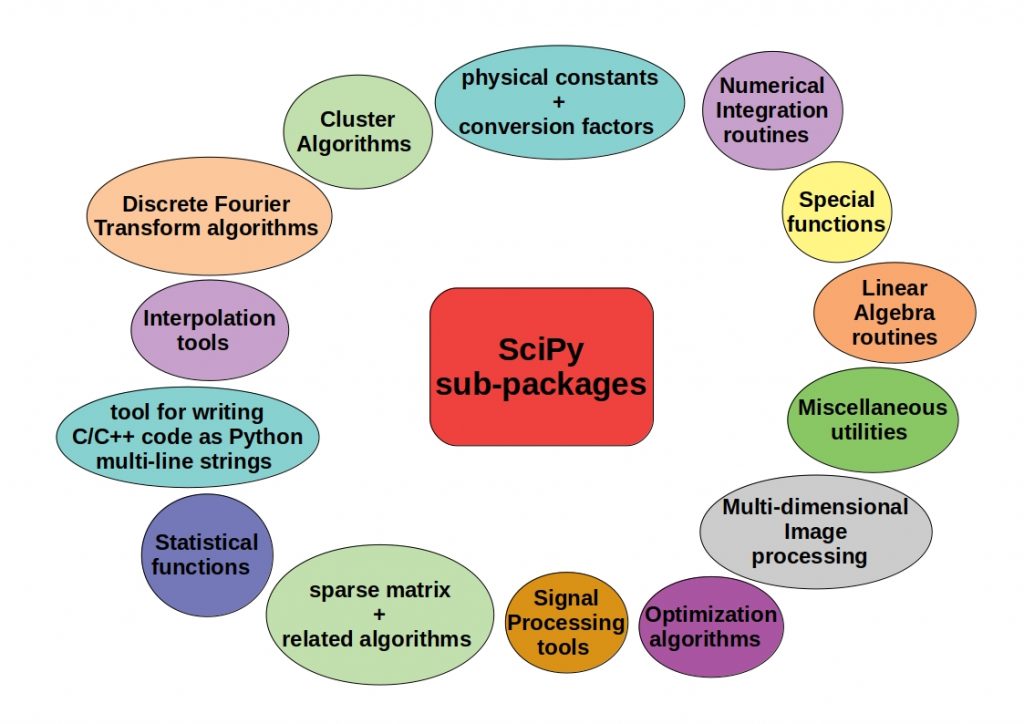
– SciPy library provides many user-friendly and efficient numerical routines:

scipy subpackages

Available sub-packages

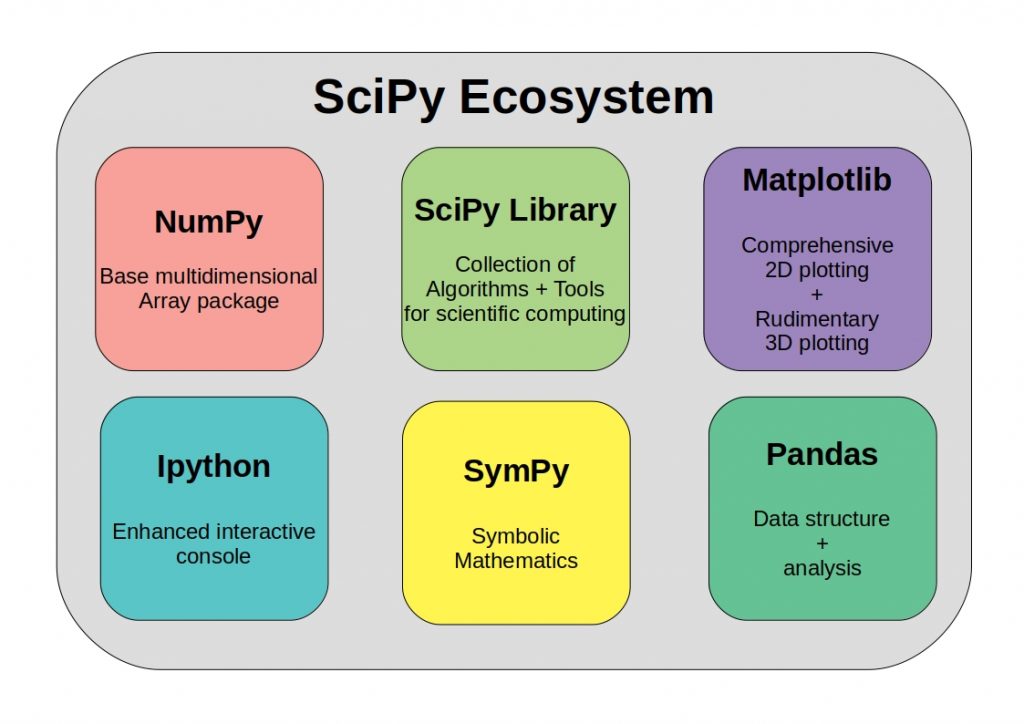
SciPy ecosystem

– scienitific computing in Python builds upon a small core of open-source software for mathematics, science and engineering

scipy ecosystem
SciPy Core Software

More relevant Packages

– the SciPy ecosystem includes, based on the core properties, other specialized tools

scipy eco sidepackages

The product and further information can be found here:

https://www.scipy.org/