One of the most popular unsupervised clustering methods is the k-means algorithm. It is considered one of the easiest and most cost-effective clustering algorithms to create. It is therefore well suited to identify an overview of possible patterns in data.
What is the principle behind the k-means algorithm?
in this article we will explain what is behind this algorithm and how it really works, because, the better you know your data science tools, the better you will be able to analyze your data.
Table of Contents
What is k-Means?
The k-means algorithm described by MacQueen, 1967 goes back to the methods described by.
Lloyd, 1957 and Forgy, 1965 described methods. The unsupervised machine learning algorithm is used for vector quantification or cluster analysis. If you don’t know what the differences are between supervised, unsupervised and reinforcement methods, read this article on the main machine learning categories.
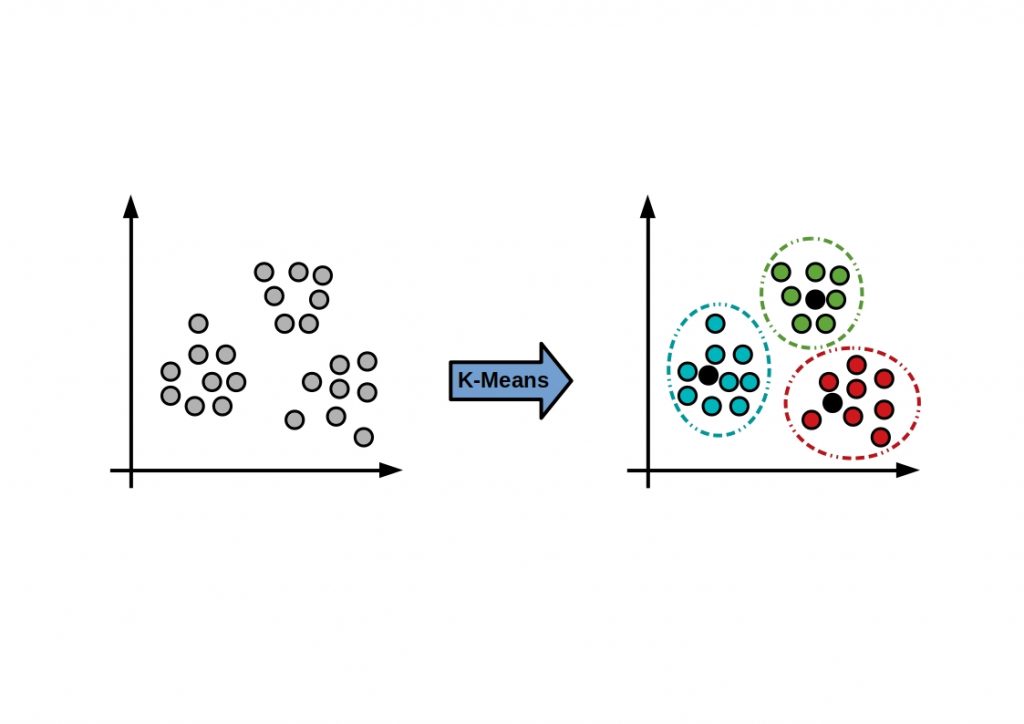
The following figure shows the basic principle of the k-Means clustering algorithm.


The main goal of unsupervised clustering is to create collections of data elements that are similar to each other, but dissimilar to elements in other clusters.
What is the principle behind the k-means algorithm?
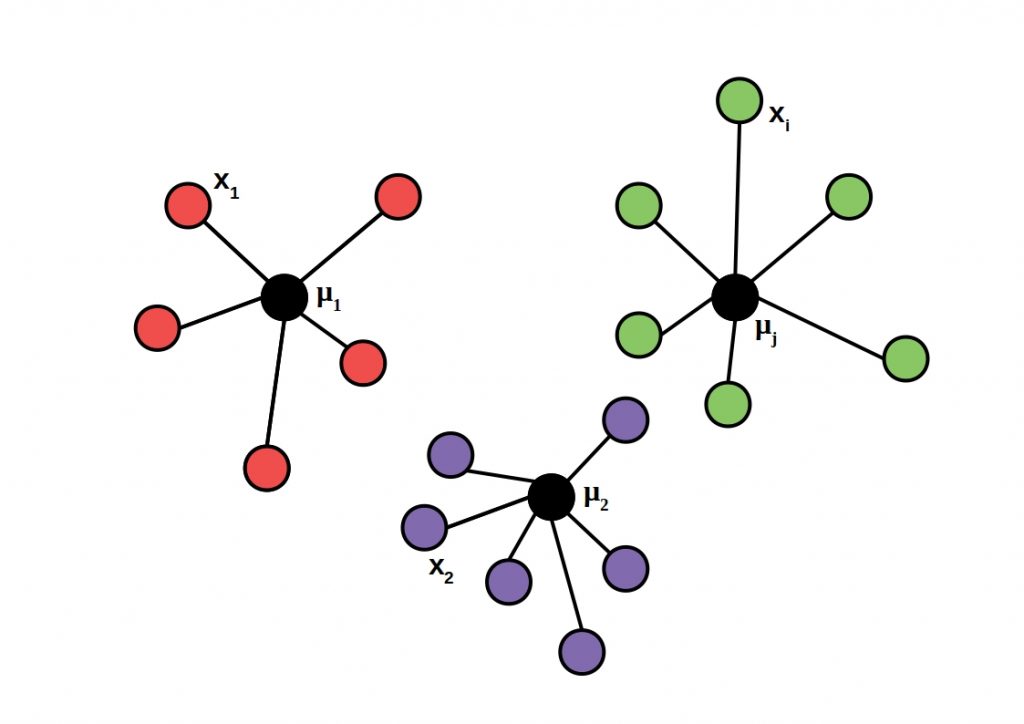
Here, a data set is partitioned into k groups with equal variance. The number of clusters searched for must be specified in advance. Each disjoint cluster is described by the average of all contained samples.
The so-called cluster centroid.
The following figure shows the cluster center of gravity principle.


Each centroid is updated to represent the average of its constituent instances. This is done until the assignment of instances to clusters does not change.
Applied algorithm process
But how exactly does the algorithm work?
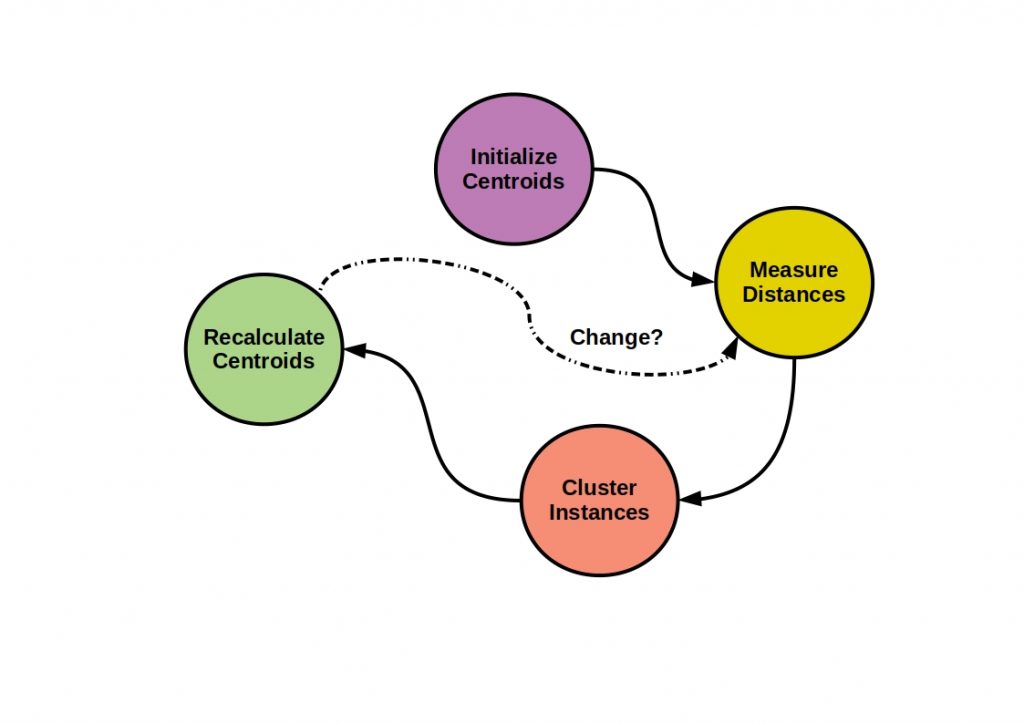
First, initial centroids are set. The distances between data instances and centroids are measured and data instances are added as members of the nearest centroid. The centroids are recalculated. If necessary, final centroids are re-measured, re-clustered or re-calculated


0 Comments
1 Pingback